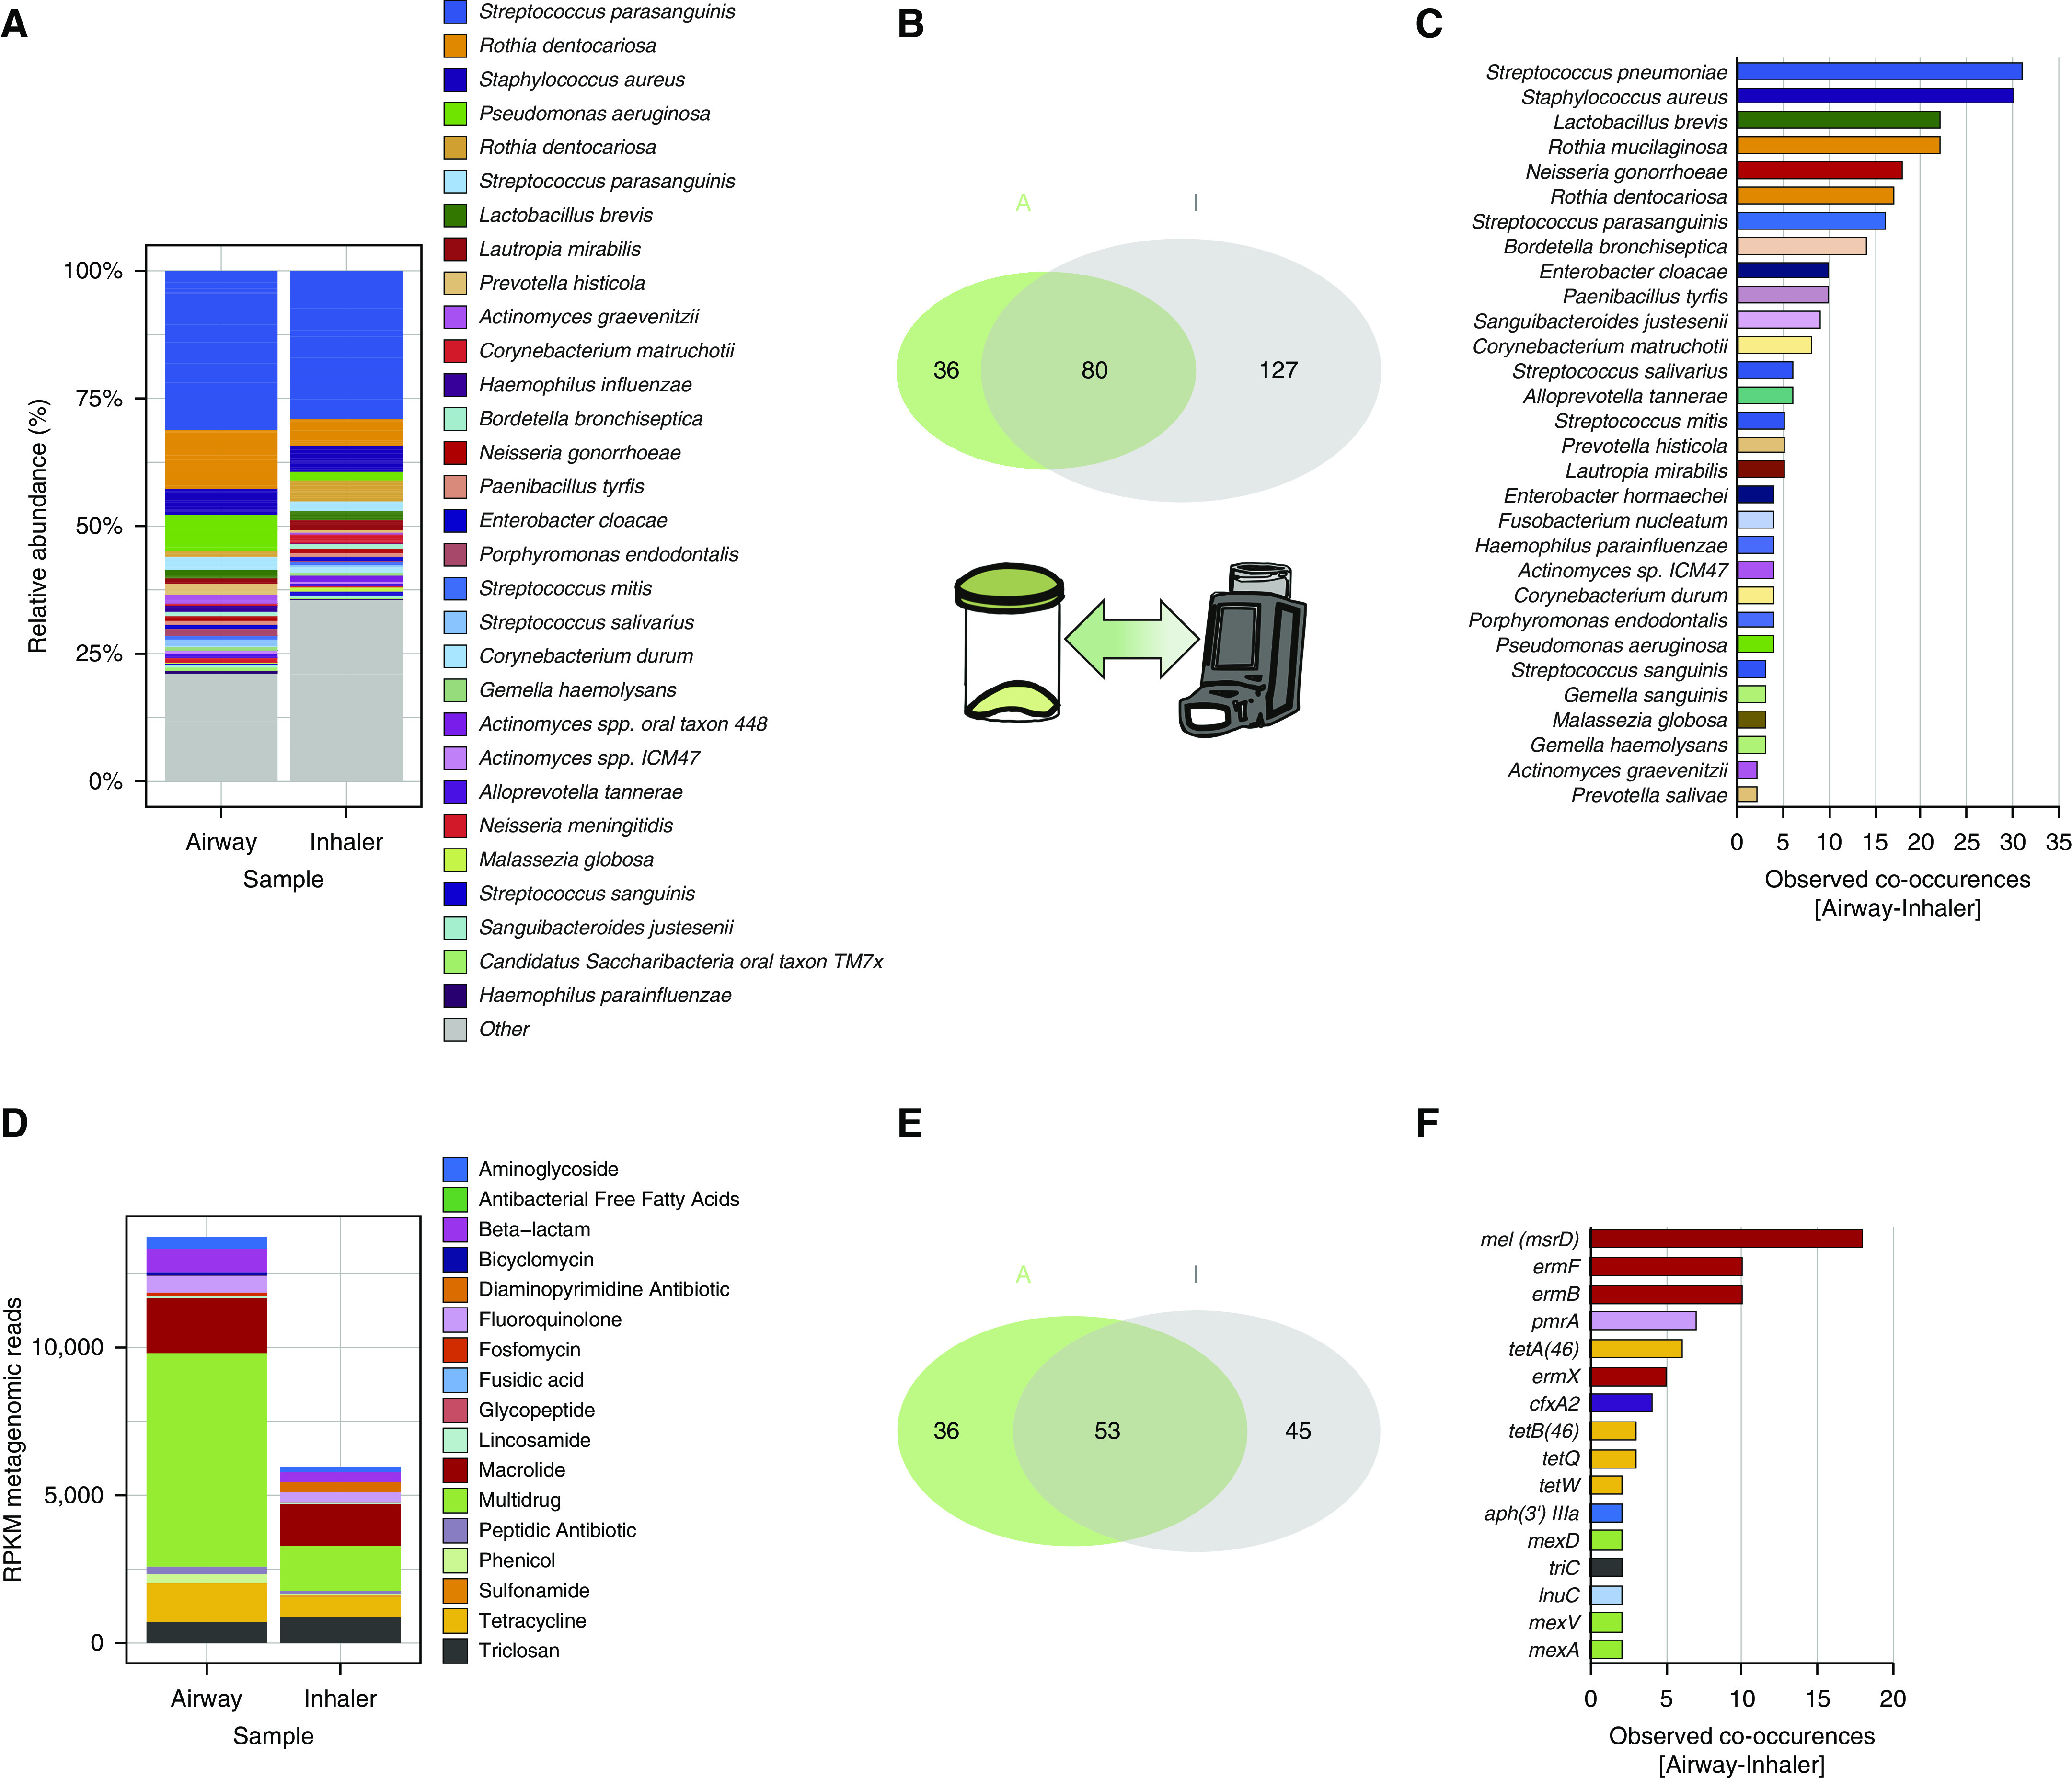
Figure 5.

Metagenomics assessment of inhaler devices as potential antibiotic resistance reservoirs. Metagenomics shotgun analyses were performed on paired (airway–inhaler) specimens obtained through sputum collection and swabbing of mouthpieces of patient-inhaler devices. n = total of 31 pairs consisting of n = 16 (severe asthma), n = 11 (chronic obstructive pulmonary disease), and n = 4 (bronchiectasis). (A) Microbiome profiles of paired airway–inhaler devices exhibit a comparable overall pattern illustrated by stacked bar plots of a species-level relative abundance. (B) Venn diagram illustrating the observed metagenomics-derived microbial taxa present in the airway (green set, “A,” n = 116) and inhaler device (gray set, “I,” n = 207) and the co-occurrence of microbial species that are detectable in both groups (intersect, n = 80). Thirty-six and 127 species were therefore unique to the airway sputum and inhaler metagenomics profiles, respectively. (C) Horizontal bar plot indicating microbial species confirmed to co-occur in paired specimens (i.e., species found in both the airway and inhaler device of the same patient) (n = 63 species). (D) Resistance gene profiles for paired airway–inhaler devices demonstrate comparability with a higher abundance of resistance genes (measured in RPKM) detected in airway specimens. (E) Venn diagram illustrating the observed diversity of resistance genes detected in airway specimens (green set, “A,” n = 89) and inhaler devices (gray set, “I,” n = 98) by metagenomics. Co-occurrence of a significant number of microbial species were detected (intersect, n = 53 species). Thirty-six and 45 resistance genes were unique to the airway sputum and inhaler metagenomics profiles, respectively. (F) Horizontal bar plot indicating resistance genes confirmed to co-occur in paired specimens (i.e., genes found in both the airway and inhaler device of the same patient) (n = 46 genes). Gene co-occurrences observed in n ≥ 2 subjects are plotted. RPKM = reads per kilobase million.
