
Figure 3.
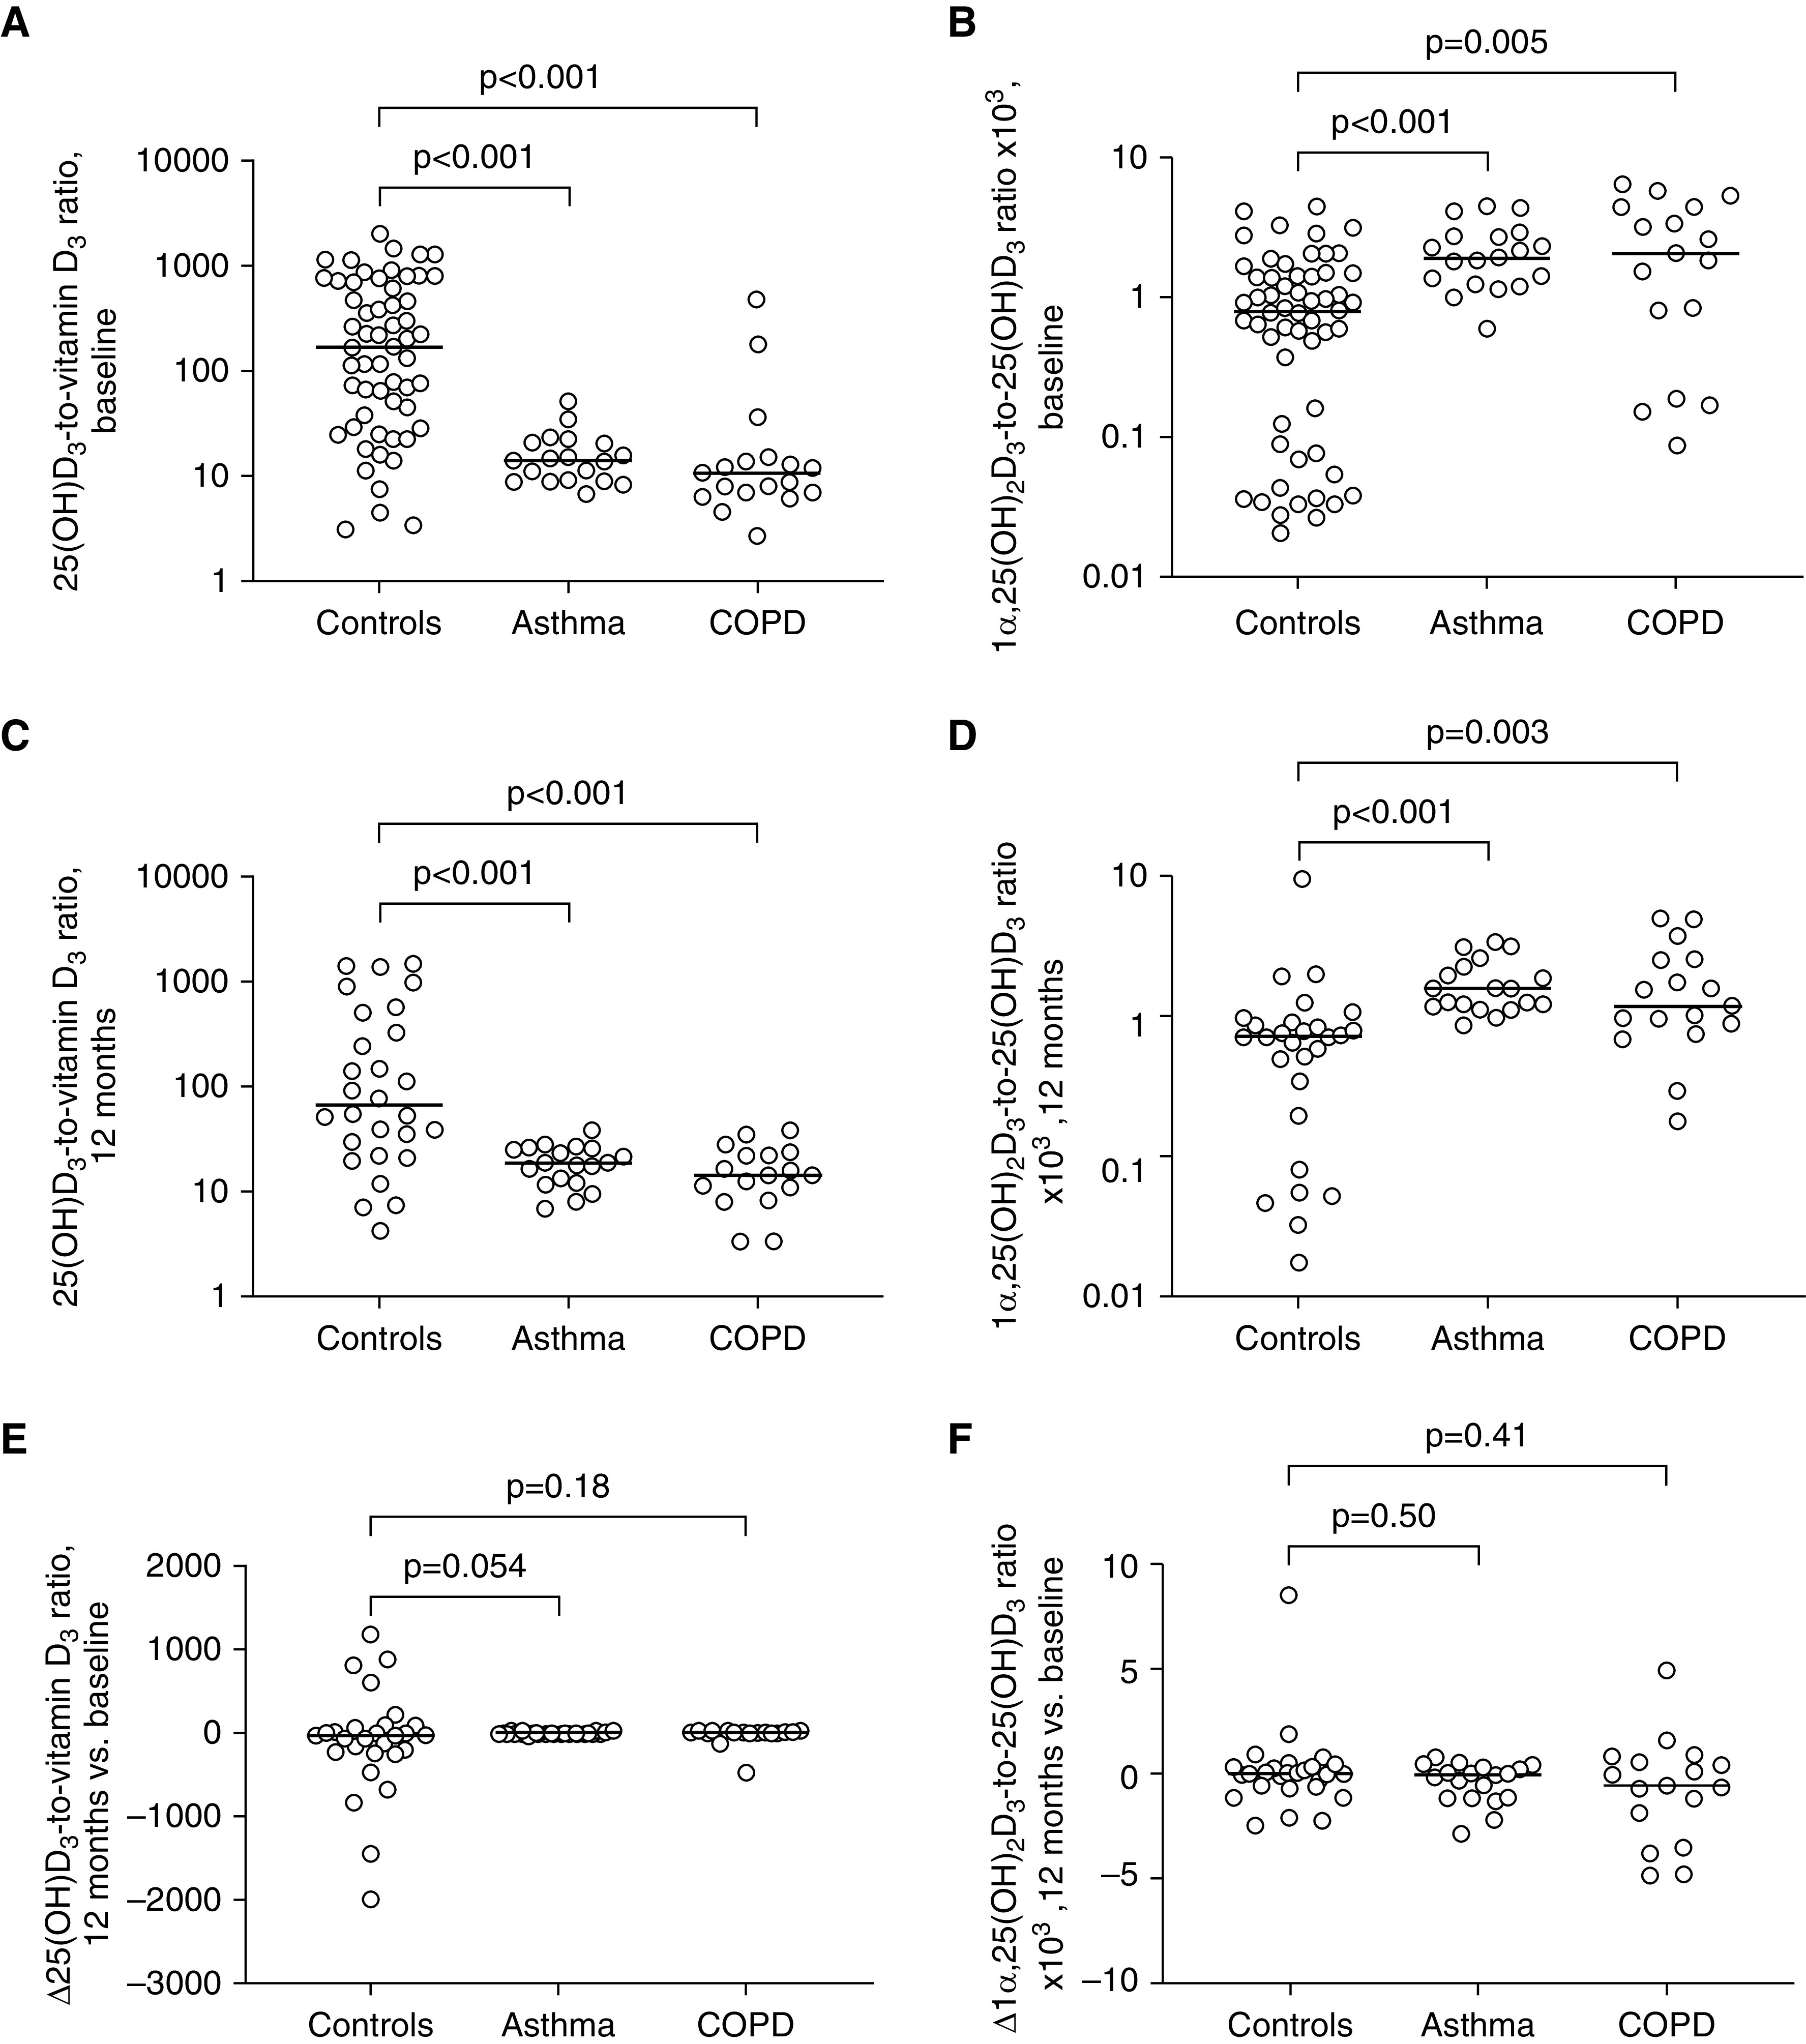
Vitamin D metabolite-to-parent compound molar ratios by disease status, presupplementation and postsupplementation. (A) Presupplementation 25-hydroxyvitamin D (25[OH]D3)-to-vitamin D3 molar ratios in adults with asthma (n = 19), COPD (n = 17), or neither condition (control subjects, n = 57). (B) Presupplementation 25-hydroxyvitamin D3–to–25(OH)D3 molar ratios in the same groups. (C) Postsupplementation 25(OH)D3-to-vitamin D3 molar ratios in adults with asthma (n = 19), COPD (n = 17), or neither condition (control subjects, n = 28). (D) Postsupplementation 1α,25(OH)2D3-to-25(OH)D3 molar ratios in the same groups. (E) Change in (Δ) 25(OH)D3-to-vitamin D3 molar ratios at follow-up versus baseline in adults with asthma (n = 19), COPD (n = 17), or neither condition (control subjects, n = 28). (F) Δ1α,25(OH)2D3-to-25(OH)D3 molar ratios at follow-up versus baseline in adults with asthma (n = 19), COPD (n = 17), or neither condition (control subjects, n = 28). P values from Mann-Whitney tests. Bars show median values in each group. COPD = chronic obstructive pulmonary disease.