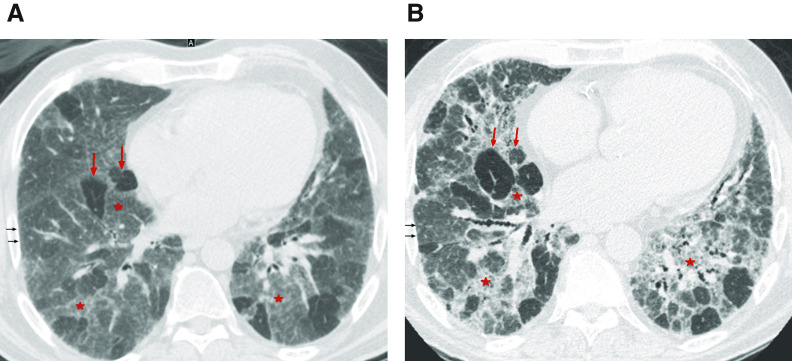
Figure 2.
Three-density pattern. High-resolution computed tomography (A) inspiratory and (B) expiratory images from a patient with hypersensitivity pneumonitis demonstrating the three different densities: high attenuation (ground-glass opacity) (red stars), lucent lung (regions of decreased attenuation and decreased vascular sections) (red arrows), and normal lung (black arrows), which are sharply demarcated from each other.

