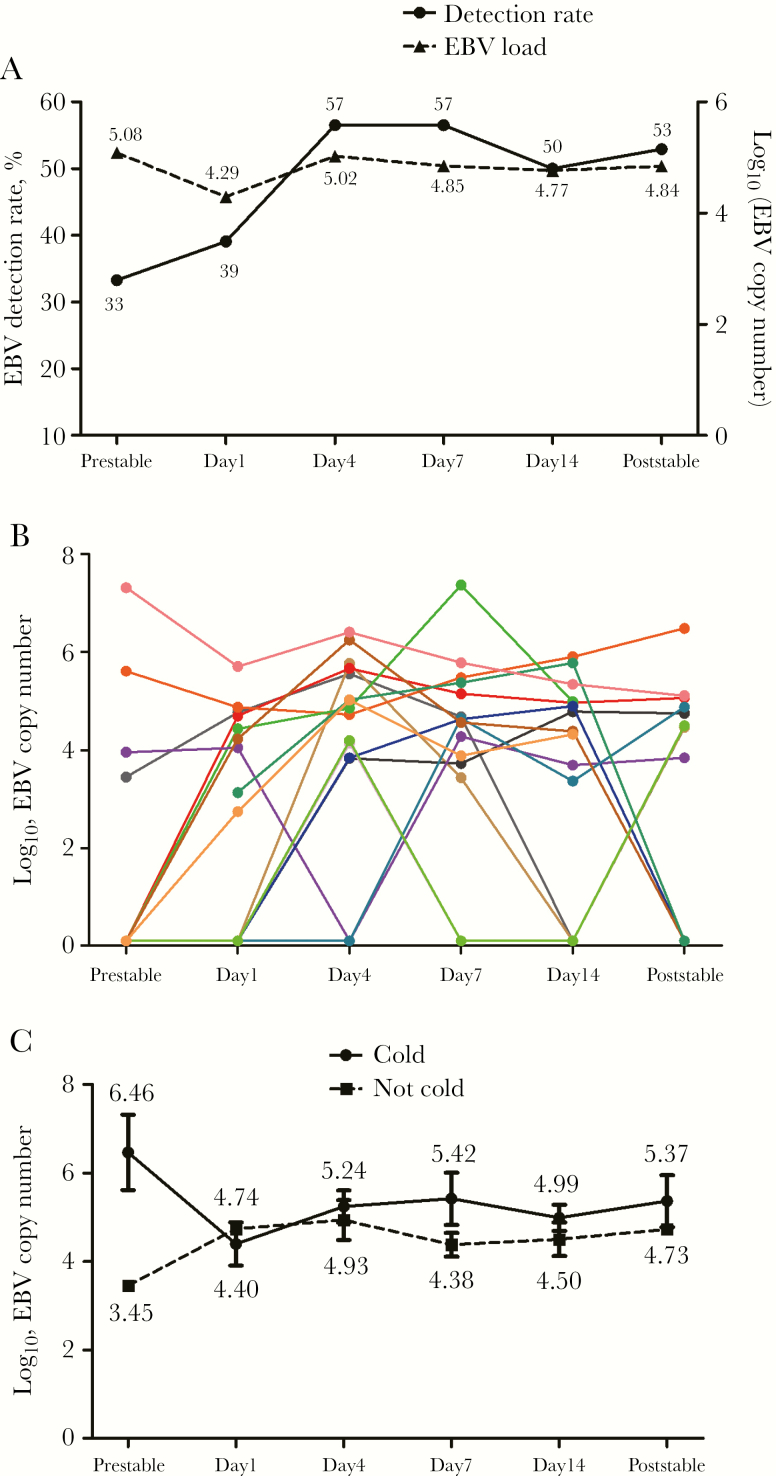
Figure 2.
Changes in the detection rate and load of EBV at stable visits and during the natural course of AEs and convalescence. A, Changes in the EBV detection rate and EBV load (log10 load) during the natural course of AEs and convalescence. B, Change in the EBV load at stable visits and during the natural course of AEs and convalescence within the same bronchiectasis patient. C, Change in the EBV load at stable visits and during the natural course of AEs and convalescence in patients with and without cold symptoms. Data are presented as percentage and mean (SD). The numbers appearing at different time points indicate the log10 load for EBV in sputum. The colors in Figure 2B represent different individual bronchiectasis patients. Day 1: within 2 (IQR, 2.0–3.3) days of the onset of AE symptoms; Poststable: median 45 (IQR, 40–54) days from the onset of AE symptoms. Abbreviations: AE, adverse event; EBV, Epstein-Barr virus; IQR, interquartile range.

