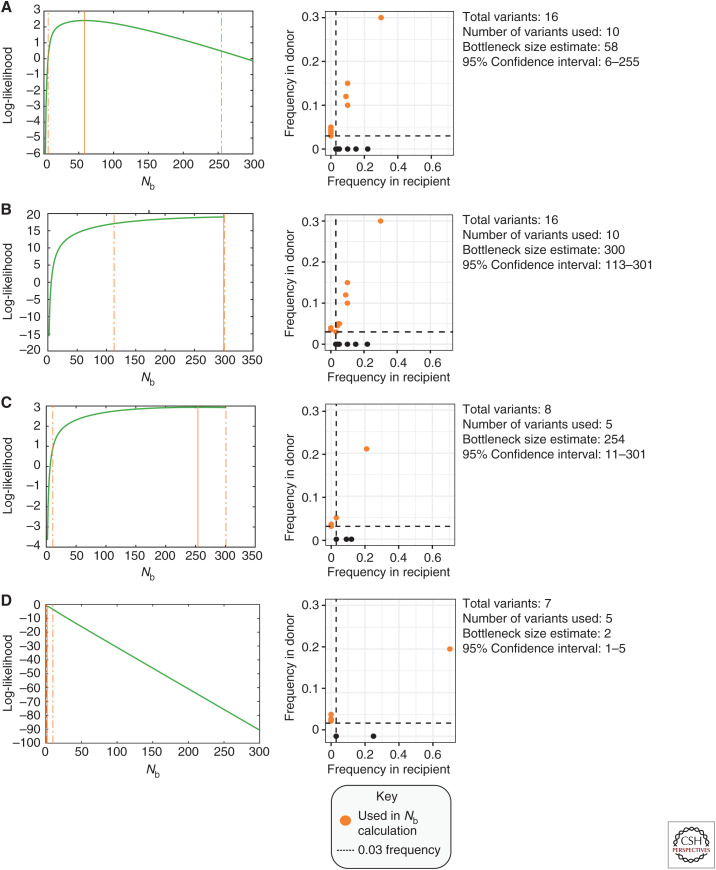
Figure 3.
β-binomial bottleneck size estimates (Nb). The frequency and number of minor variants shared between donor and recipient are factors in the transmission bottleneck size estimate. Orange points highlight variants used for the β-binomial calculation. Black points indicate de novo mutations identified in the recipient but not the donor. Dashed lines indicate the 3% frequency cutoff used to identify minor variants in sequencing data. (A,B) Examples of donors and recipients with high shared diversity. Increasing the number of shared variants (B) increases the overall bottleneck size estimate. (C,D) Examples of donors and recipients with low numbers of virus variants, commonly observed in acute influenza infections. (C) Variants shared at a similar frequency within the donor and recipient generate a large bottleneck estimate with wide confidence intervals. (D) Stringent bottlenecks are observed when few minor variants are shared between donor and recipient, and the frequency of a shared variant becomes dominant (>50% frequency) in the recipient host.

