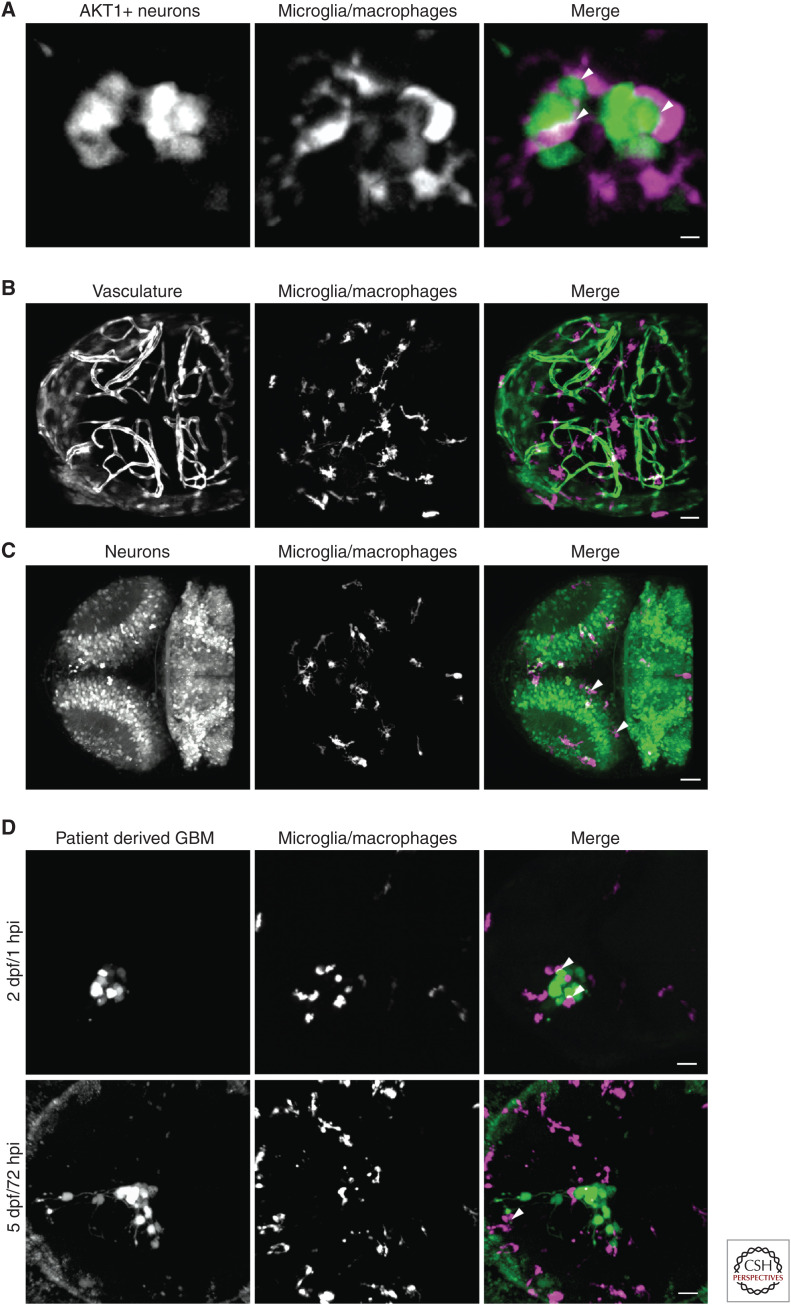
Figure 1.
Confocal fluorescent microscopy enables an analysis of cell interactions, in vivo and in real time. (A) Oncogenesis was achieved in zebrafish neurons (green) by misexpression of a constitutively active form of human AKT1. Direct cellular interactions (white arrowheads) between the oncogenic neurons and microglia/macrophages (magenta) were visualized in vivo in real time. The image is a maximum intensity projection, scale bar is 5 µm. (B,C) By combining fluorescent reporter transgenic lines and transparent zebrafish strains, the zebrafish becomes a powerful system for observing cellular interactions and tissue structures. (B) The Tg(fli1:GFP:mpeg1:mCherry) double transgenic zebrafish allows the vasculature (green) and microglia/macrophages (magenta) to be visualized in the zebrafish brain. (C) Tg(nbt:dsRed:mpeg1:EGFP) double transgenic zebrafish allow visualization of neurons (green) and microglia/macrophages (magenta) in the zebrafish brain. White arrowheads indicate apoptotic neurons that have been phagocytozed by the microglia/macrophages and are being digested within phagosomes. Images are maximum intensity projections showing the dorsal view of representative 3 d postfertilization (dpf) zebrafish embryo brains. Scale bars are 30 µm. (D) The invasiveness and cellular interactions of xenografted patient-derived tumor cells within the zebrafish brain can be investigated over time. Human, patient derived, glioblastoma multiforme cells (GBM; green) were transplanted into the left optic tectum of 2 dpf Tg(mpeg1:mCherry) zebrafish larvae. The larvae were imaged at 1 h postinjection (hpi) and at 72 hpi. Direct cellular interactions between the human tumor cells and the zebrafish microglia/macrophages (magenta) were observed at both time points (white arrowheads). The human cancer cells not only survived and proliferated within the zebrafish brain, but also exhibited an invasive phenotype, becoming more dispersed within the brain and extending long cellular processes into the surrounding brain tissue. Images are maximum intensity projections showing the dorsal view of a representative 2 dpf and a 5 dpf zebrafish embryo brain. Scale bars are 30 µm.

