Figure 3.
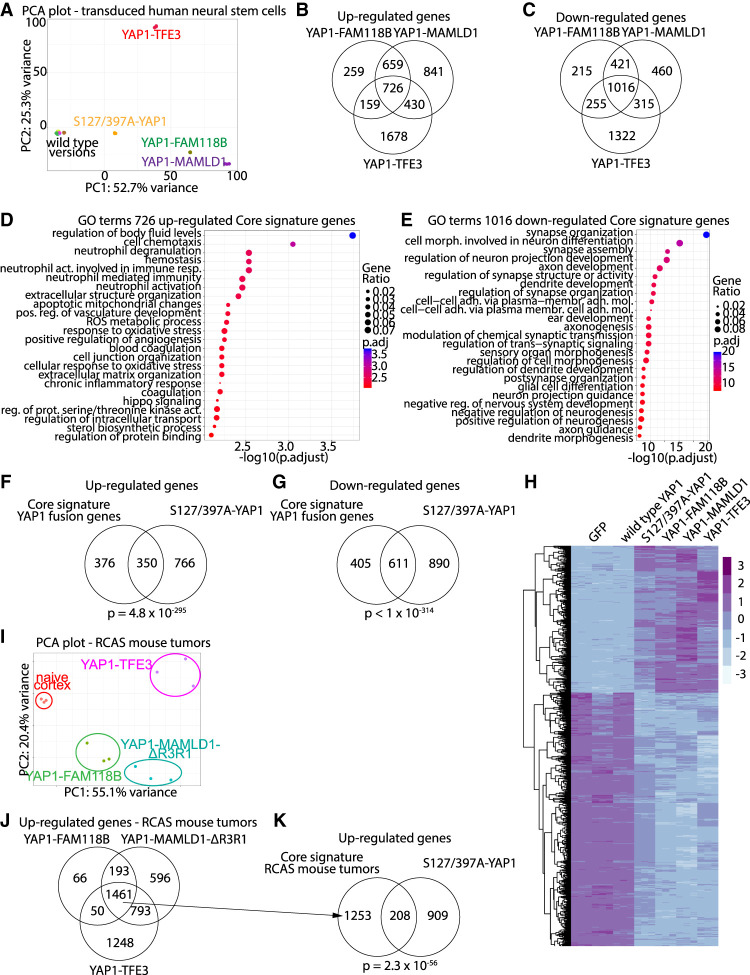
RNA-seq analysis of human neural stem cells expressing YAP1-MAMLD1, YAP1-FAM118B, or YAP1-TFE3. (A) PCA plot of RNA-seq samples. (B,C) Venn diagrams showing the overlaps of up-regulated (B) and down-regulated (C) genes of YM-, YF-, or YT-expressing cells. (D,E) Biological process GO terms of the up-regulated (D) and down-regulated (E) YAP1 fusion core genes shared by all three YAP1 fusion genes. (F,G) Overlap between up-regulated (F) and down-regulated (G) YAP1 fusion core gene signatures and respective DEGs in 2SA-YAP1-expressing cells. (H) Heat map showing expression levels of core genes significantly regulated in 2SA-YAP1-, YM-, YF-, or YT-expressing samples. (I) PCA plot of RNA-seq samples from naïve mouse cortex tissue and RCAS tumors. (J) Overlap of up-regulated genes between the different RCAS mouse tumor types. (K) Overlap between the up-regulated genes shared by all three RCAS mouse tumor types and genes up-regulated in 2SA-YAP1-expressing cells. (B,C,F,G,J,K) Analysis was done using a hypergeometric test.

