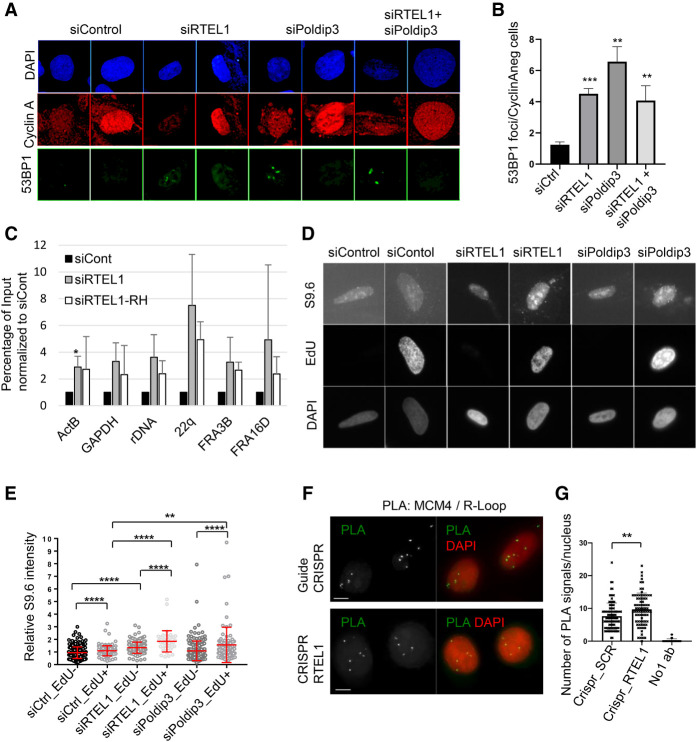
Figure 5.
R loops accumulate at specific genomic loci and associate with replication after RTEL1 depletion. (A) Increased 53BP1 bodies in Cyclin A-negative U2OS cells depleted of RTEL1, Poldip3, or RTEL1 and Poldip3. Representative images showing DAPI and 53BP1 staining in U2OS cells treated with control, RTEL1, Poldip3, or RTEL1 and Poldip3 siRNA. (B) Quantification of A. The average of three independent experiments are shown. (**) P < 0.01; (***) P < 0.001, Student's t-test. (C) DNA:RNA hybrids accumulate at commonly expressed genes (GAPDH and ActB), common fragile sites (FRA3B and FRA16D), telomeres (22q) and rDNA in U2OS cells depleted of RTEL1. Results are obtained with qPCR from DNA samples captured by DNA–RNA immunoprecipitation (DRIP) from siCont or siRTEL1 U2OS samples untreated or treated with RNase H (RH). Percentage of input normalized to siCont from three experiments are shown. (*) P < 0.01, Student's t-test. (D) Increased amount of R loops in EdU-positive RTEL1- or Poldip3-depleted cells. Representative images of S9.6, EdU, and DAPI staining in RTEL1- and Poldip3-depleted cells. (E) Quantification of S9.6 nuclear fluorescence intensity in control, RTEL1 or Poldip3 siRNA-treated EdU-positive or EdU-negative U2OS cells. Values normalized to siCtrl. Mean and SD are plotted (**) P < 0.01; (****) P < 0.0001, two-tailed Mann-Whitney test. (F) Proximity ligation assay (PLA) of S9.6 and MCM4 after RTEL1 knockout. HeLa cells sorted (GFP) 48 h after transfection with either CRISPR–Cas9 against RTEL1 or CRISPR control and put on slides. PLA revealing MCM4 and R-loops. (G) Quantification of F. (SCR) Scrambled control guide. (**) P < 0.01, Mann-Whitney test.

