Figure 5.

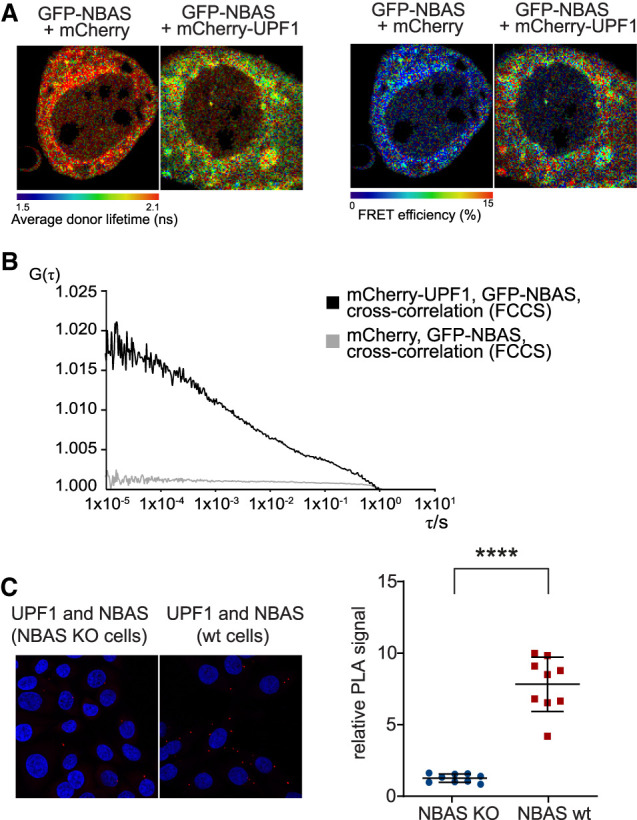
NBAS and UPF1 interact directly. (A) The interaction between NBAS and UPF1 was measured by FRET-FLIM. The average fluorescence lifetime of GFP-NBAS donor molecules was measured in HeLa cells expressing GFP-tagged NBAS together with mCherry-UPF1 or mCherry, as a control. Cells were pseudocolored by average lifetime (ns) where red represents longer lifetime and green corresponds to a shorter lifetime. (Right panel) Average fluorescence lifetime was used to calculate the FRET efficiency. Cells were pseudocolored by FRET efficiency (percentage). (B) The interaction between NBAS and UPF1 was measured by fluorescence cross-correlation spectroscopy (FCCS) in HeLa cells transiently expressing GFP-NBAS and mCherry-UPF1 or GFP-NBAS and mCherry, as a control. Increased G(τ) amplitude of the average cross-correlation curves corresponds to higher cross-correlation (higher fraction of codiffusing molecules) of GFP-NBAS and mCherry-UPF1 (in black), as compared with GFP-NBAS and mCherry average cross-correlation (in gray). (C) A direct interaction between endogenous NBAS and UPF1 was determined by PLA using antibodies against endogenous UPF1 and NBAS proteins in HeLa cells. The PLA signal in wild-type (WT) HeLa cells was compared with a HeLa NBAS knockout (KO) cells, as a negative control. The PLA signal was quantified in the graph where each point represents mean PLA count in one captured frame, relative to NBAS KO negative control. Significance was determined by two-tailed Mann-Whitney test. (****) P < 0.0001.
