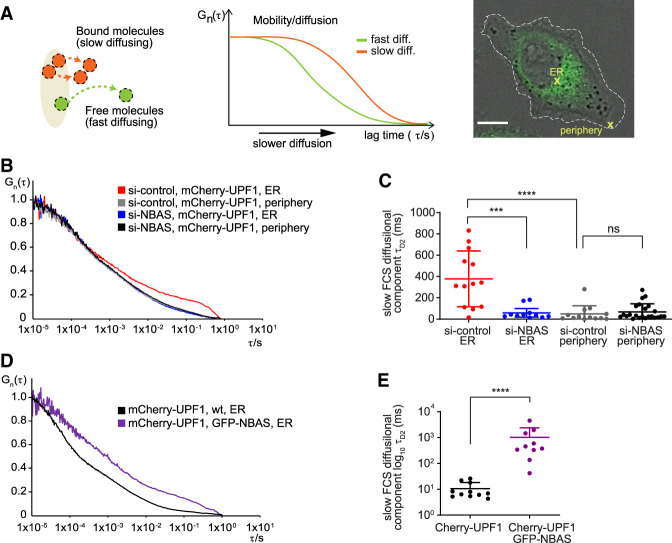
Figure 6.
NBAS recruits UPF1 to the ER. (A) Schematic representation of the principle of fluorescence correlation spectroscopy (FCS). See the Materials and Methods for details. (B) Average autocorrelation curves of mCherry-UPF1 at the ER or cell periphery in the presence (si-control) or absence of NBAS (si-NBAS) are displayed. (C) Graph showing the derived characteristic decay times τD2 (slow FCS component) of mCherry-UPF1, after fitting of the autocorrelation curves with a two-component model for diffusion (plus triplet correction). Significance was determined by the two-tailed Mann-Whitney test. (****) P < 0.0001; (***) P < 0.001; (ns) not significant. (D) Average autocorrelation curves of mCherry-UPF1 at the ER with physiological (WT) or increased (GFP-NBAS) level of NBAS expression. (E) Characteristic decay times τD2 (slow FCS component), derived as in C of mCherry-UPF1 at the ER. Significance was determined by the two-tailed Mann-Whitney test. (****) P < 0.0001. Data showing FCS control experiments are in Supplemental Figure S8.

