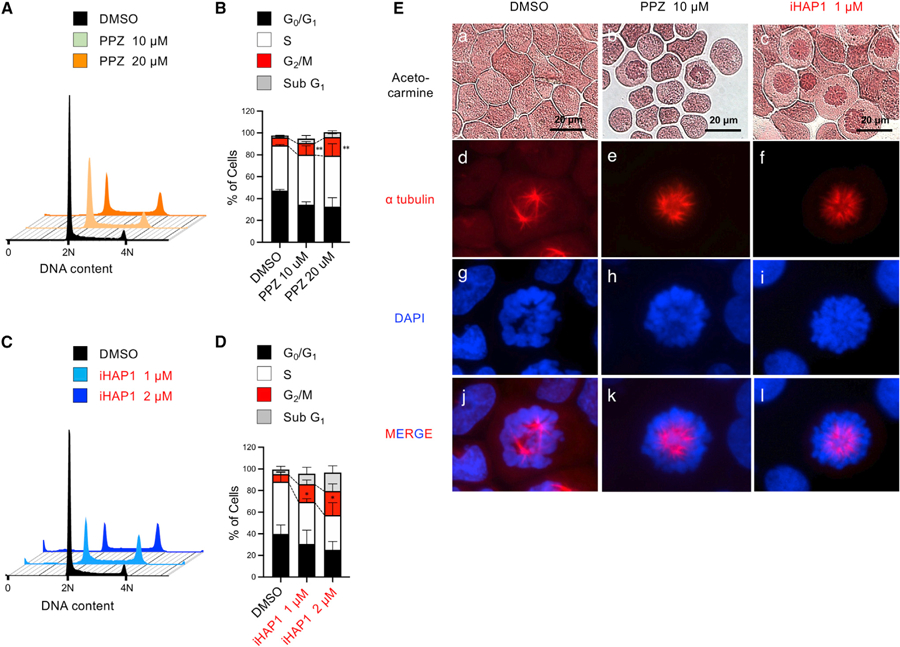
Figure 3. PPZ- and iHAP1-Mediated Activation of PP2A Leads to Prometaphase Cell Cycle Arrest with Spindle Monopolarity in T-ALL Cells.

(A) Relative DNA content of KOPT-K1 cells, determined by flow cytometric analysis of propidium iodide (PI) staining. Cells were treated with the DMSO control or PPZ for 24 h.
(B) Cumulative results of the cell cycle analysis in (A). **p < 0.01 by Student’s t test, comparing the means ± SD of three biological replicates.
(C) Relative DNA content of KOPT-K1 cells was determined by flow cytometry analysis of PI staining. Cells were treated with the DMSO control or iHAP1 for 24 h.
(D) Cumulative results of the cell cycle analysis in (C). *p < 0.05 by Student’s t test, comparing the means ± SD of three biological replicates.
(E) Acetocarmine (a-c), Alexa Fluor 647 (red) anti-a tubulin antibody (d-f and j-l), and DAPI (g-i and j-l) were used to stain cytospins of KOPT-K1 cells for chromatin, microtubules, and DNA, respectively. Cells were treated with DMSO, 10 µM PPZ, or 1 µM iHAP1 for 24 h.
