
Figure 4. Identification of MYBL2 as the Primary Substrate of PP2A Activated by PPZ and iHAP1 Treatment.
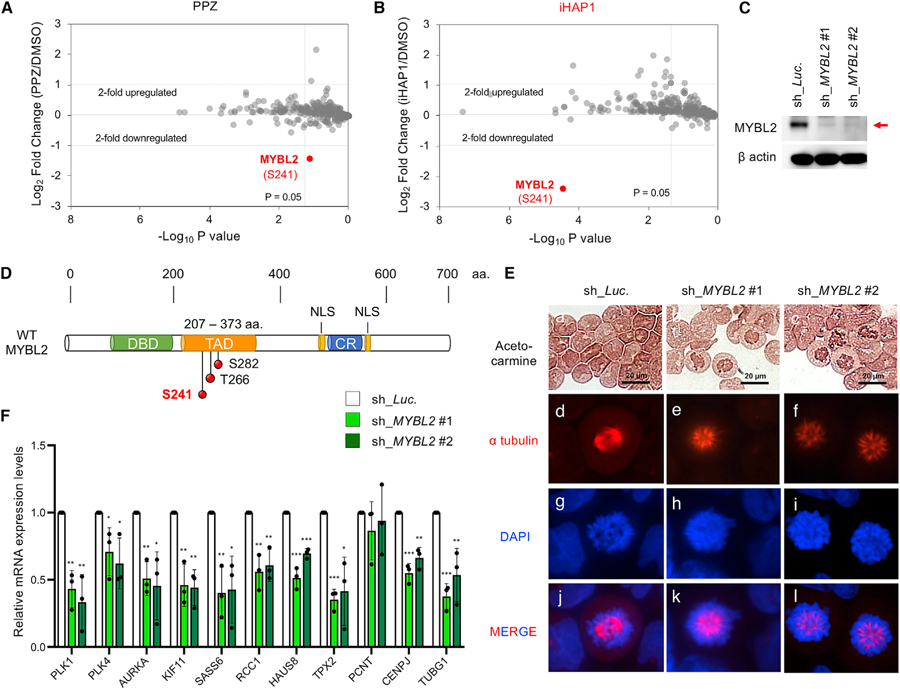
(A and B) Phosphopeptides studied by SILAC in KOPT-K1 cells and phosphoproteomics analysis after treatment with (A) 10 µM PPZ or (B) 1 µM iHAP1 for 3 h. Control cells were fed light leucine, whereas treated cells received heavy leucine; the cells were then mixed for 3 h. Phosphopeptides were enriched with titanium beads, and the log2 ratio of phosphopeptides containing heavy versus light leucine by mass spectrometry was plotted on the y axis. The x axis shows the statistical significance of the fold difference by Student’s t test (triplicate experiments).
(C) Representative western blot images of cell lysates from KOPT-K1 cells expressing shRNAs that target control luciferase transcripts (sh_Luc.) or MYBL2 (sh_MYBL2 #1 and #2).
(D) Schematic representation of WT MYBL2. The structure depicts the relative locations of the DNA binding domain (DBD), TAD/acidic region, conserved region (CR), and nuclear localization signals (NLSs). The positions of three serine/threonine phosphorylation sites are represented by red circles in the TAD region (S241, T266, and S282). aa, amino acid.
(E) Morphologic assessment of KOPT-K1 cells expressing shRNAs that target control luciferase (sh_Luc.) or MYBL2 (sh_MYBL2 #1 and #2). Acetocarmine, Alexa Fluor 647 (red) anti-a tubulin antibody, and DAPI were used to stain chromatin, microtubules, and DNA, respectively.
(F) Inducible shRNA depletion of MYBL2 in KOPT-K1 cells for 24 h, followed by measurement of the relative mRNA expression levels of a set of genes whose loss is known to cause cell cycle arrest in the spindle monopolarity phase of prometaphase (McKinley and Cheeseman, 2017). *p < 0.05, **p < 0.01, ***p < 0.001, comparing the means ± SD of three biological replicates versus controls (Student’s t test).