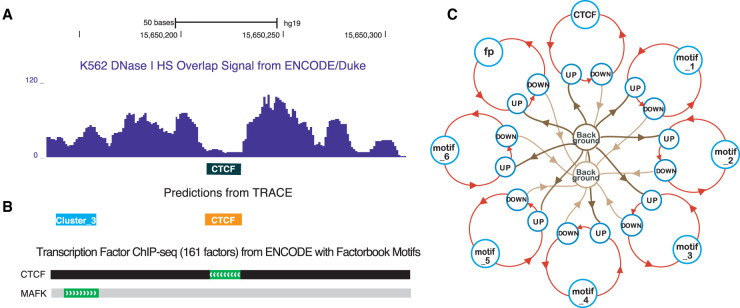
Figure 1.
Computational footprinting can detect TFBSs at nucleotide resolution. (A) An example of digestion pattern at footprints: DNase I base overlap signal centered at CTCF motif sites (black box). (B) Predicted binding sites from TRACE using our 10-motif CTCF model match a corresponding region of TF binding obtained by ChIP-seq experiments with DNA-binding motifs by the ENCODE Factorbook repository. (MAFK is a member of cluster 3 motifs.) (C) Simplified example schematic of a seven-motif CTCF model. Circles represent different hidden states including multiple motifs; lines with arrows represent transitions between different states. For simplicity, TOP states are not shown in the model structure.

