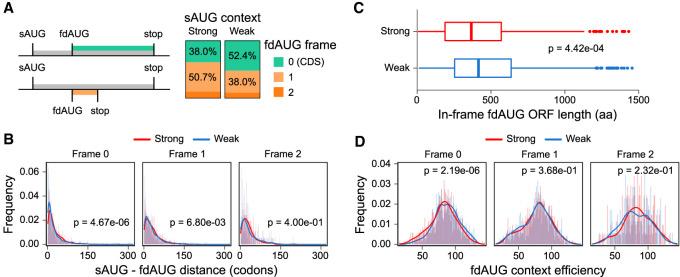
Figure 1.
Relationship between Kozak context of sAUGs and locations of fdAUGs. (A) A schematic for classification of fdAUGs as in-frame and out-of-frame is shown on the left. Bar plots on the right show the proportion of fdAUGs in three different frames relative to sAUGs. (B) Distribution of distances between sAUGs and fdAUGs depending on fdAUG frame in strong and weak data sets (Mann–Whitney U test). (C) Boxplots showing distribution of lengths between in-frame fdAUGs and the next in-frame stop codons in the weak and strong sAUG data sets (Mann–Whitney U test). (D) The distribution of fdAUGs Kozak context strengths (as measured by Noderer et al. 2014) depending on fdAUG frame for strong and weak data sets (Student's t-test).

