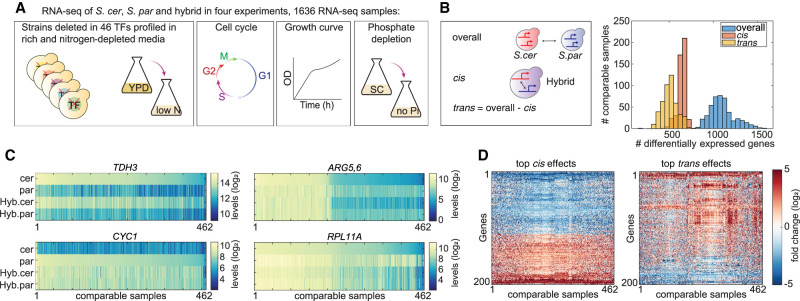
Figure 1.
Generating a compendium of comparative transcription profiles. (A) Experimental scheme. The transcription profiles of S. cerevisiae (S. cer), S. paradoxus (S. par), and the interspecific hybrid were measured in four experiments (Methods; Supplemental Table S3). Overall, 1636 samples were acquired, composed of 530–570 samples per species. The “YPD to low nitrogen” experiment was divided into three time points, each comprising 130 samples per species. (B) Hundreds of genes vary in expression level between species in each individual condition. Differentially expressed genes between species (overall), between hybrid alleles (cis), and in trans (overall-cis) were defined via DESeq2 per experiment (log2 fold change > 1, adjusted P-value < 0.05). Presented here is the distribution of genes that pass the fold change threshold in each condition and pass the P-value threshold in at least one experiment. (C) Examples of cis- and trans-varying genes: steady cis effect (TDH3), steady trans effect (CYC1), condition-dependent cis effect (ARG5,6), and condition-dependent trans effect (RPL11A). Shown are the log2-transformed expression levels of the indicated genes in the species and hybrid alleles, as measured in all samples in our data set. Samples were sorted according to expression levels in S. cerevisiae in TDH3, ARG5,6, and RPL11A, and by S. paradoxus in CYC1. (D) Consistency of cis and trans effects across conditions. Shown are log2 fold changes in cis (left) and trans (right) of the top 200 cis- and trans-affected genes.

