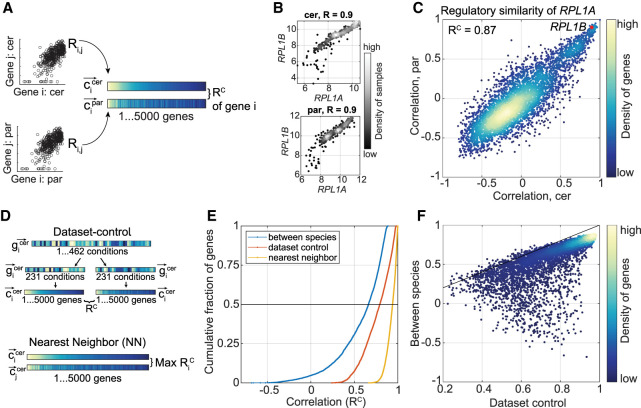
Figure 2.
Gene coexpression as a measure of regulatory similarity. (A) RC measures regulatory similarity between species. First, the pairwise correlation of gene i with all other expressed genes is measured per species. Then, the correlation of these coexpression vectors is measured, termed RC. (B) Ribosomal protein genes are highly coexpressed in both species. Shown are log2-transformed expression levels of the indicated genes in S. cerevisiae and in S. paradoxus across conditions. Pearson correlation coefficients are indicated. (C) RPL1A is regulated similarly in both species. Presented are coexpression vectors of RPL1A in S. cerevisiae (x-axis) and in S. paradoxus (y-axis), each vector comprised of 4772 genes, correlation of these (RC) is indicated. The RC value is written in the top left of the scatter plot. (D) Within data set controls. Two within data set controls were defined per species, as shown. First, data set control is obtained by splitting the set of conditions into two random subsets and measuring the gene regulatory similarity (RC) between them. Second, nearest neighbors (NN) are defined as the pair of genes with the most similar coexpression vectors. (E) Distribution of regulatory similarity scores. Shown is the cumulative distribution of the indicated measures. As NN and data set control were defined per species, here we present the mean score of the two species. (F) Control RC correlates with comparative RC. Each dot represents the RC score of a single gene, between species (y-axis) and the mean data set control of the two species (x-axis). Black line is x = y.

