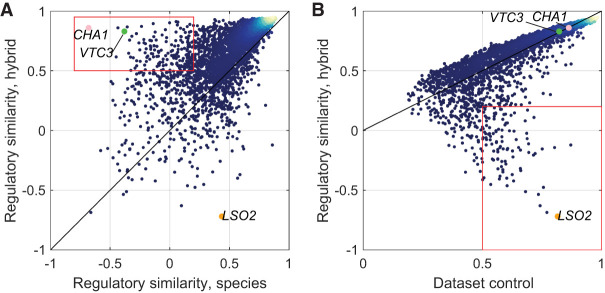
Figure 4.
Regulatory dynamics vary mainly in trans. (A) Defining trans-varying genes. Plotted are RC scores between hybrid alleles as a function of RC scores between species for all genes. Black line is x = y. Genes in the red rectangle vary in trans (184 genes). Indicated genes vary in trans (VTC3, CHA1) and in cis (LSO2) and are discussed in subsequent figures. Color represents density. (B) Defining cis-varying genes. Plotted are RC scores between hybrid alleles as a function of RC scores of the mean hybrid data set control. Genes in the red rectangle vary in cis (106 genes).

