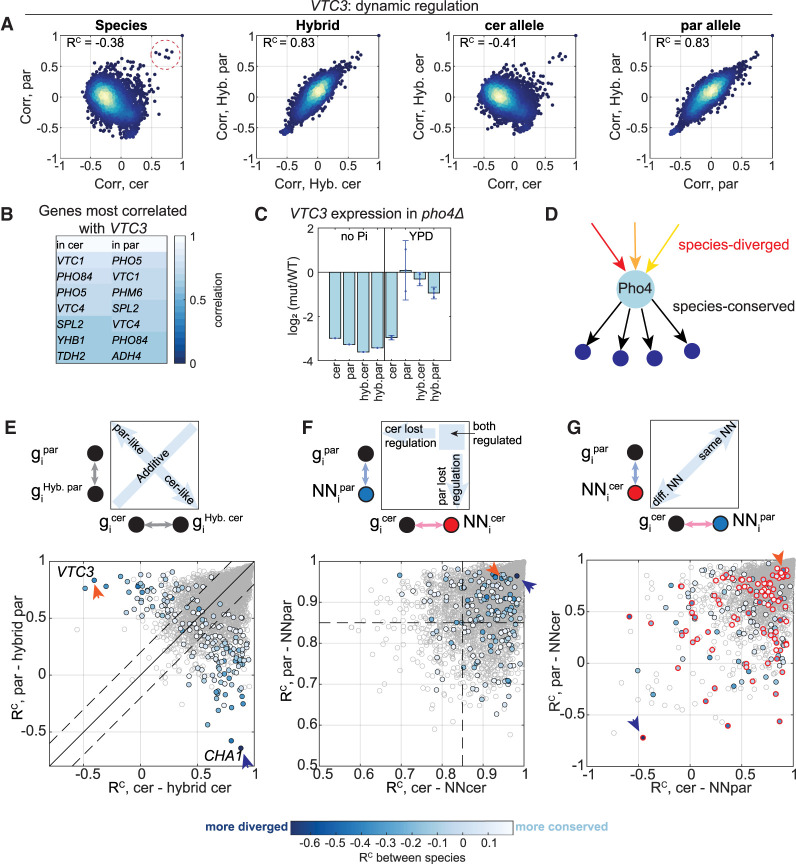
Figure 5.
Trans-variations in dynamic regulation are inherited dominantly. (A) VTC3 is an example of a trans-varying gene. Scatters of coexpression vectors between species, between hybrid alleles, between S. cerevisiae and hybrid-cerevisiae, and between S. paradoxus and hybrid-paradoxus. Each dot represents the coexpression of VTC3 with a single gene across conditions; RC scores are indicated. Genes that are highly coexpressed with VTC3 in both species are marked with a dashed red circle. (B) Pho4 activates a similar set of targets. VTC3’s highest coexpressing genes are listed. Most are shared in both species; these are known targets of Pho4 (Springer et al. 2003). (C) Pho4 is activating the expression of VTC3 in different conditions in the two species. Shown is log2 fold change (pho4Δ/WT) in gene expression of VTC3 in the indicated conditions. (D) A scheme describing Pho4 regulatory divergence. Pho4 activates the same target genes in both species, but due to different signals in each species. (E) Trans-variations in dynamic regulation are inherited dominantly. The RC scores between each species and its corresponding hybrid allele are shown, of trans-diverging genes (color, 184 genes) and of all genes (gray). Color code indicates the RC score between species. The solid black line is x = y, the dashed lines are diagonal ± 0.2, and the colored dots that pass the dashed lines represent genes that are regulated dominantly, similarly to one of the species; below the lower dashed line: cerevisiae-like (106 genes); above the upper dashed line: paradoxus-like (55 genes). Orange and blue arrow heads indicate the RC scores of VTC3 and CHA1, respectively. (F) Half the trans-diverging genes lost regulation in one of the species. The RC scores of each gene with its NN in each species are shown. The dashed line is RC = 0.85, and genes below it are referred to as genes with impaired regulation. Color code as in E. (G) Cross-species NN similarities vary between genes. Cross-species NN similarities are shown. The x-axis is the similarity of a gene in S. cerevisiae to the gene's NN as defined in S. paradoxus; the y-axis is the similarity of a gene in S. paradoxus to the NN as defined in S. cerevisiae. In the scheme on the top, the circles represent genes and the arrows represent in which species the similarity was calculated (S. cerevisiae in pink, S. paradoxus in light blue). Color code as in E. Genes that preserve high correlation with their NN (RC > 0.85 in F) are indicated with a red circle.

