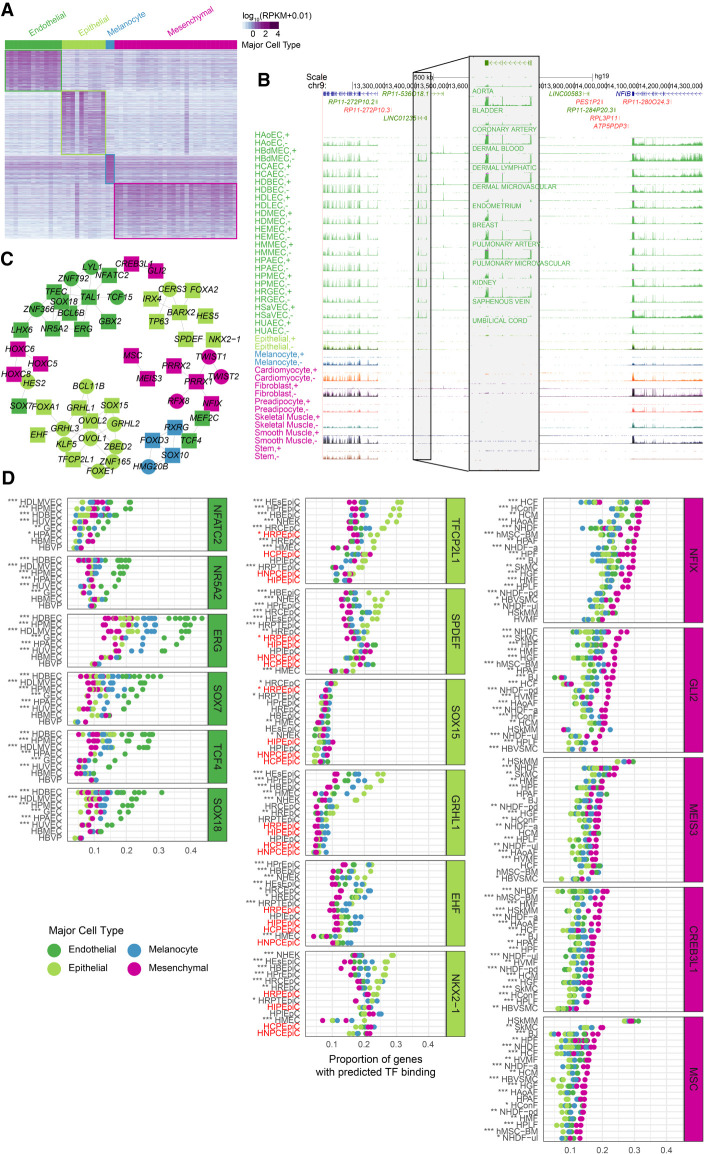
Figure 2.
Cell-cluster-specific genes. (A) Expression of 2871 genes specific to major cell types. (B) Expression of the endothelial-specific lncRNA LINC01235. Separate strand-specific signal tracks are shown for endothelial cells, and the other tracks contain overlaid signal for each cell type. The lncRNA has highly correlated (correlation coefficient >0.9) expression with 72 protein-coding genes across our set of primary cells. Nearly all these genes are endothelial specific, and they are functionally enriched for vessel development and angiogenesis (Supplemental Fig. S13A). The gene appears to be under relatively strong regulation, because it has almost 1500 eQTLs across multiple tissues in GTEx (v7), well above the average eQTLs for lncRNAs (about 450). (C) Network of the most strongly coexpressed (Pearson's r > 0.85) cell-type-specific transcription factors (TFs). Nodes are colored according to the cell type specificity of the TF, and they shaped based on the availability of sequence motif: (square) available; (circle) not available. (D) Proportion of cell-type-specific genes with predicted TF binding over cell-type-specific genes that harbor a DHS around their TSS (−10 kb/+5 kb), individually for each cell-type-specific TF (with binding motif available) and cell line for which DNase-seq data was available. In general, we found that genes specific to a given type are enriched for binding motifs for TFs specific to that type. For example, the proportion of endothelial-specific genes with DHS sites that harbor motifs for the endothelial-specific TF ERG in dermal blood endothelial cells (HDBEC) is larger than the proportion of genes with DHS sites specific of other major cell types. Primary cells highlighted in red, although included within the epithelial major cell type, they have been labeled as neural/epithelial in Figure 1D, and they are therefore not proper epithelial; consistently, they do not show the enrichment in binding motifs for epithelial-specific transcription factors. Refer to Supplemental Table S6 for a complete description of the acronyms. Enrichment adjusted P-values: (*) <0.05; (**) <0.01; (***) <0.001.

