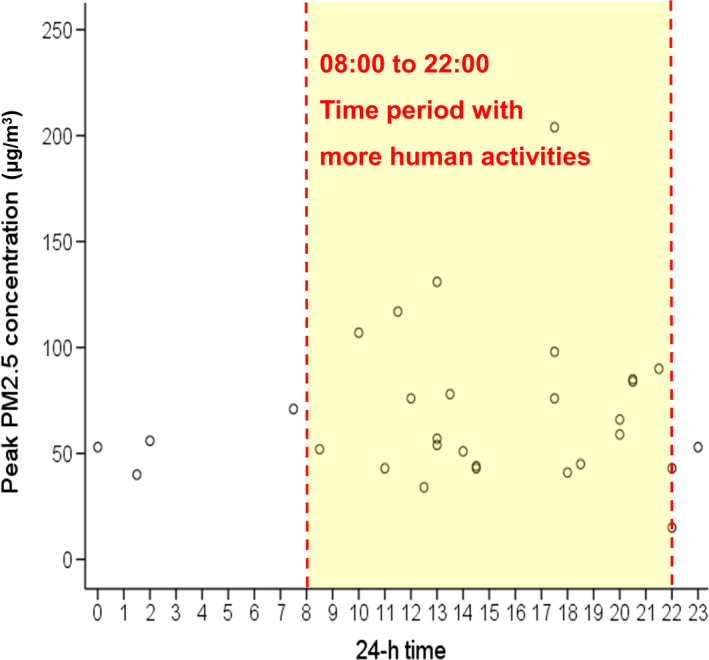
Figure 2.

Scatterplot showed that peak PM2.5 concentrations (μg/m3) from 24‐hr recording were more commonly present during 8 a.m.–10 p.m., which represents a time period with more human activities relative to the sleep period of the pet owners (10 p.m.–8 a.m.)
