
Figure 3.
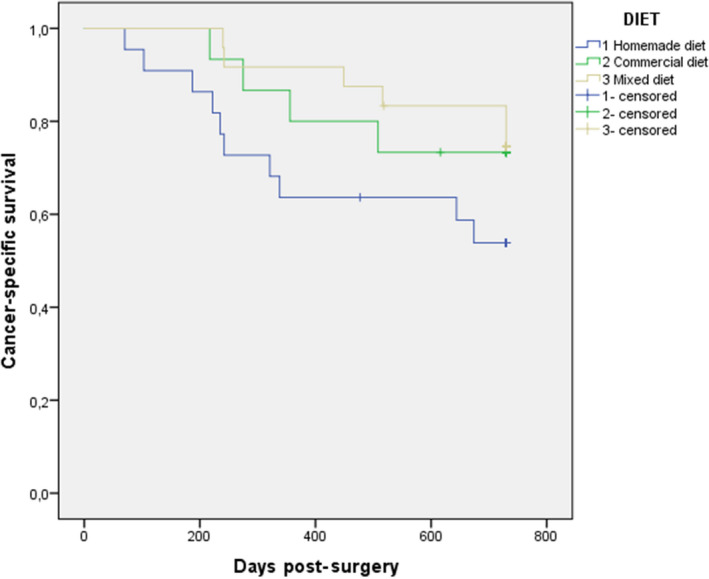
Cancer‐specific survival curve (a) for the group of 73 bitches bearing mammary carcinomas subdivided depending on the type of diet (homemade diet: blue line, commercial diet: green line and mixed diet: yellow line; p > .05)
Official websites use .gov
A
.gov website belongs to an official
government organization in the United States.
Secure .gov websites use HTTPS
A lock (
) or https:// means you've safely
connected to the .gov website. Share sensitive
information only on official, secure websites.
Cancer‐specific survival curve (a) for the group of 73 bitches bearing mammary carcinomas subdivided depending on the type of diet (homemade diet: blue line, commercial diet: green line and mixed diet: yellow line; p > .05)