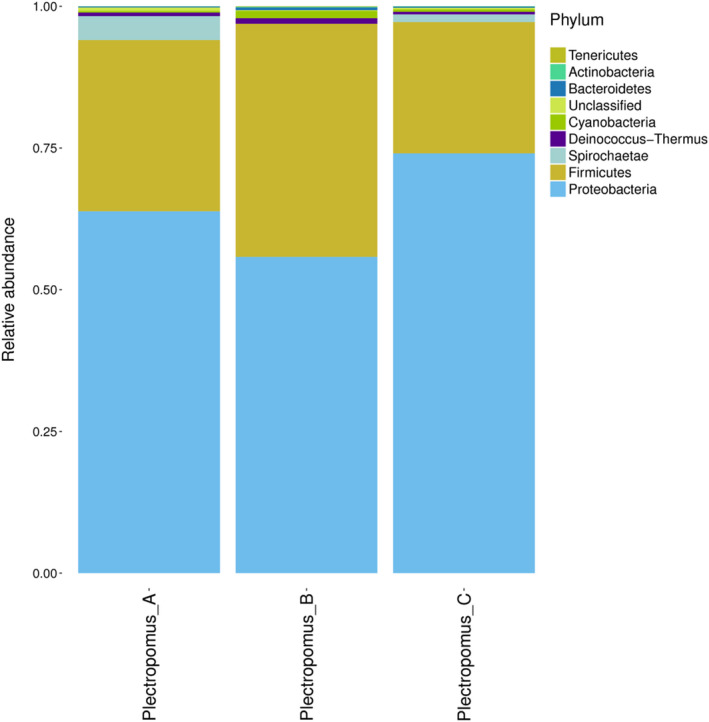
FIGURE 2.

The gut bacteria communities at the phyla level of all samples in the control and enrofloxacin bathing treatment. The color‐coded bar plot showed the percentages of intestinal bacteria communities in Plectropomus_A, Plectropomus_B and Plectropomus_C at the phylum level. Plectropomus_A = control group (no enrofloxacin), Plectropomus_B = 5 mg/L enrofloxacin bathing group, Plectropomus_C = 10 mg/L enrofloxacin bathing group
