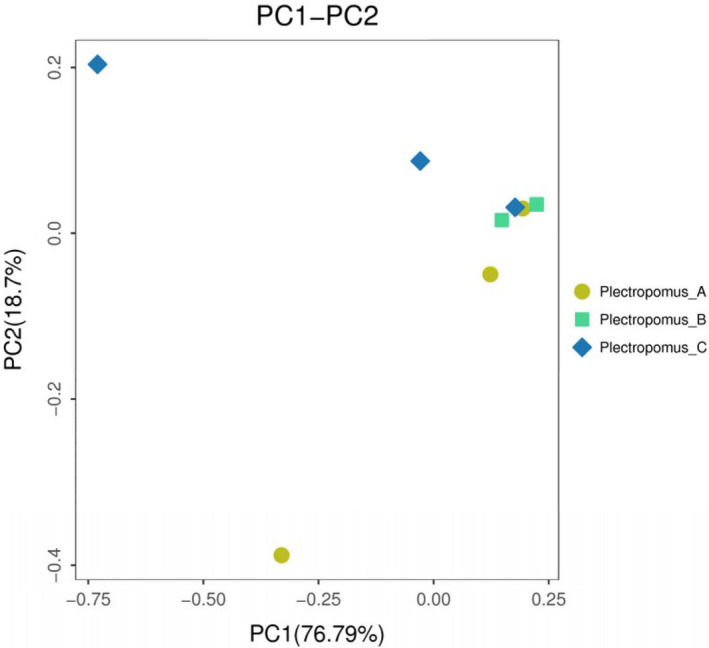
FIGURE 5.

PcoA analyzed the bacteria community. The colored circles represent the bacteria in Plectropomus_A, Plectropomus_B and Plectropomus_C. Plectropomus_A = control group (no enrofloxacin), Plectropomus_B = 5 mg/L enrofloxacin bathing group, Plectropomus_C = 10 mg/L enrofloxacin bathing group
