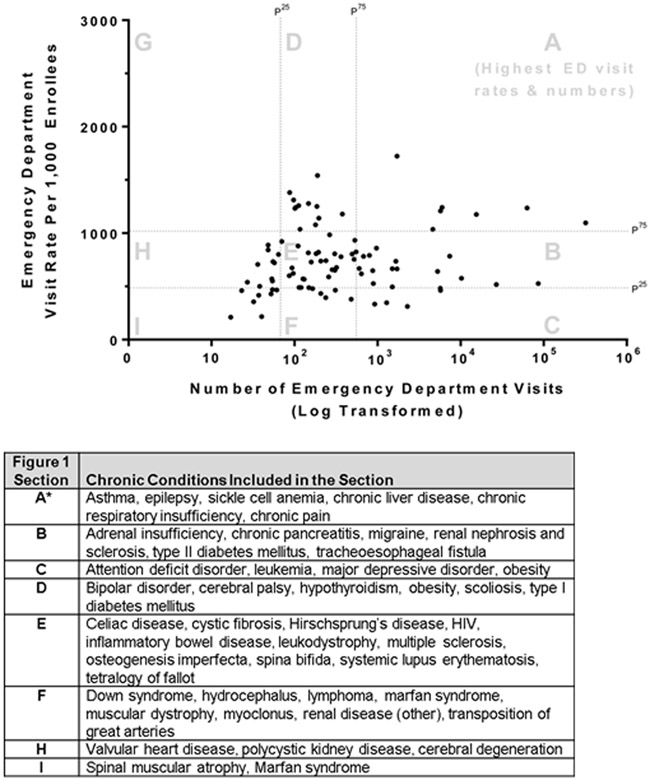
Figure 1.
Figure sections, labeled with letters A through I, are divided by the 25th and 75th percentiles of the distribution of annual ED visits (x-axis) and ED visit rates (y-axis). The dots in each section represent mutually exclusive groups of children distinguished by their single chronic condition. Chronic conditions included in each section are presented in the accompanying table. For ED visits, the 25th and 75th percentiles are 67 and 548 per 1000 enrollees. ED visits are presented in log-transform to produce a better visualization of the data. For annual ED visit rates, the 25th and 75th percentiles are 493 and 1003 per 1,000 enrollees
*Highest ED visit rates and numbers of the study population

