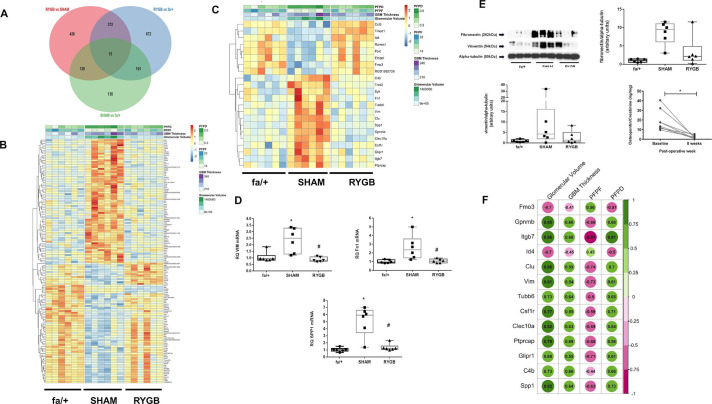
Figure 4.
RYGB normalizes the expression of genes that correlate with markers of renal injury and cross-reference to the human DKD transcriptome. (A) Venn diagram showing number of gene changes in each differential expression analysis and extent of overlap. (B) Heatmap of expression of 144 genes significantly changed in both SHAM versus fa/+ and RYGB versus SHAM comparisons. (C) Heatmap of expression of genes changed in both comparisons that cross-reference to significantly altered expression profiles in microarray analysis of glomerular isolates from 13 healthy living donors, and 9 patients with diabetic nephropathy (Nephroseq-Woroniecka dataset). In both B and C, color intensity for each sample in the heatmaps reflects relative abundance of given transcript based on normalized counts from RNA sequencing (RNA-Seq) with blue indicating lower expression and orange-red indicating higher expression. Heatmaps are headed by annotation of quantitative measures of glomerular structure and ultrastructure for each sample included in the analysis. Validation of expression changes in vimentin, fibronectin and Spp1 was undertaken at the mRNA level by quantitative RT-PCR (D) and western blot analysis (E). (F) Correlation of expression levels for human validated genes from panel C with quantitative measures of glomerular injury in sections of rat renal cortex. Green indicates a positive correlation and purple a negative correlation. Increasing color intensity and spot-size signifies increasing correlation coefficient. *P<0.05 vs fa/+; #p<0.05 vs SHAM. For osteopontin ELISA, *p<0.05 baseline versus postoperative week 8. DKD, diabetic kidney disease; GBM, glomerular basement membrane; PFPD, podocyte foot process diameter; PFPF, podocyte foot process frequency; RT-PCR, reverse transcriptase PCR; RYGB, Roux-en-Y gastric bypass; SHAM, sham surgery (laparotomy).

