Figure 5.
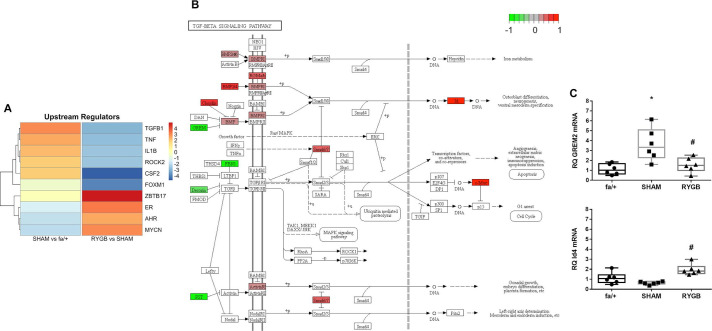
TGF-β1 pathway activation is reduced following RYGB. (A) The upstream regulator function of Ingenuity pathway analysis software was used to predict master transcriptional regulators underpinning disease-associated shifts in the renal cortical transcriptome in SHAM-operated rats and changes in the disease-associated transcriptome arising secondary to RYGB. Color intensity reflects weighted z-score. (B) Annotation of the KEGG TGF-β signaling pathway with genes, the expression of which is significantly altered by RYGB. Green signifies that expression is reduced by RYGB and red indicates increased expression following RYGB. (C) Validation of expression changes in Grem-2 and Id4 at the mRNA level was undertaken by quantitative RT-PCR. *P<0.05 SHAM versus fa/+ and #p<0.05 RYGB versus SHAM. RT-PCR, reverse transcriptase PCR; RYGB, Roux-en-Y gastric bypass; SHAM, sham surgery (laparotomy); TGF-β, transforming growth factor.

