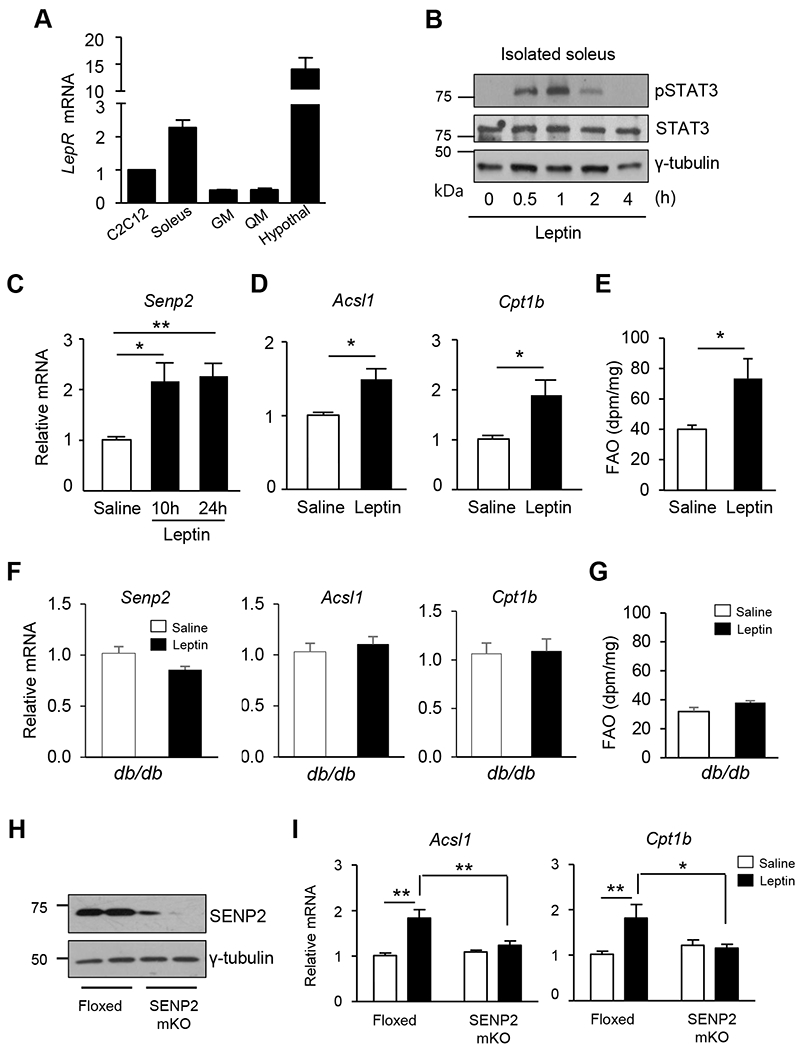
Figure 5. Effects of leptin on the transcription levels of SENP2 and FAO in vivo.

(A) Total RNAs were isolated from C2C12 myotubes or several tissues, and then real time PCR was performed using the primers specific to the leptin receptor long form (primers in the Supplemental table 1). The mRNA levels of the leptin receptor (normalized by Gapdh mRNA) in the C2C12 myotubes were expressed as 1, and the others were expressed as its relative values (n = 3). (B) Soleus muscles were isolated from mice, and then treated with leptin ex vivo. At the different time points after the treatment, muscles were homogenized, and proteins were subjected to immunoblot analysis. (C-E) C57BL/6J mice were treated with leptin (3 mg/kg, i.p.), and then the soleus muscles were isolated 10 h or 24 h after the administration. (C) SENP2 mRNA levels were determined (n = 7). (D) The mRNA levels of Acsl1 and Cpt1b, were determined in the soleus muscles prepared 24 h after the leptin treatment. The mRNA levels of saline-treated mice were set to 1 and the others were expressed as its relative values (n = 7). (E) FAO was measured 24 h after the leptin injection (n = 5). *P < 0.05, **P < 0.01 vs. saline. (F-G) Male db/db mice were treated with leptin for 24 h, and then mRNAs were prepared from soleus muscles. (F) The mRNA levels of Senp2, Acsl1 and Cpt1b were determined using real-time qPCR (n = 8). (G) FAO was measured (n = 5). (H) Tissue lysates from the skeletal muscles of control (Floxed) and SENP2 muscle specific knockout (SENP2mKO) mice were subjected to western blot analysis. (I) 10-12 week-old mice were used for the experiments. Leptin was administered to Floxed or SENP2mKO mice, and total RNAs of soleus muscles were isolated 24 h after the administration. The mRNA levels of saline-treated control mice were expressed as 1 and the others were expressed as its relative values (n =6-9). *P < 0.05, **P < 0.01. Data are presented as mean ± SEM.
