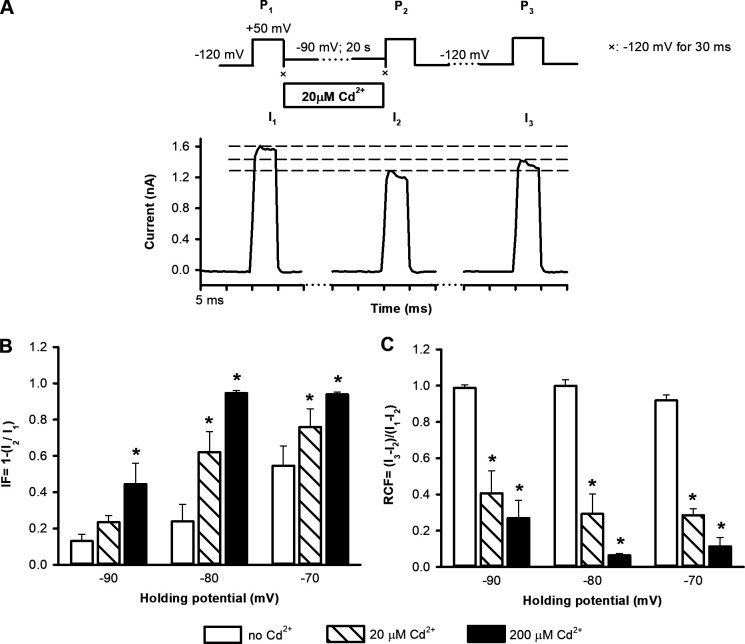
Figure 5.
Determining the IFs and RCFs with intracellularly applied Cd2+. (A) An inside-out patch expressing T449A/V474C channels was exposed to 20 µM Cd2+ between P1 and P2 at −90 mV holding potential (top; see details also in Fig. 3) The holding potential before P3 was −120 mV. Symbol × indicates a 30-ms-long pulse to −120 mV. Dashed reference lines are drawn to I1, I2, and I3. (B) Based on the peak currents for each pulse, inactivated current fractions (IF = 1 − [I2/I1]) were calculated for the indicated holding potentials in the absence of Cd2+ (empty bars) or in the presence of 20 µM Cd2+ (hatched bars) or 200 µM Cd2+ (solid bars). (C) RCFs (RCF = [I3 − I2]/[I1 − I2]) were determined for the indicated holding potentials between P1 and P2 in the absence of Cd2+ exposure (empty bars) or in the presence of 20 µM Cd2+ (hatched bars) or 200 µM Cd2+ (solid bars) during the holding between P1 and P2. Data are given as mean ± SEM (n = 5); *, significant differences when P < 0.05 throughout the figure.

