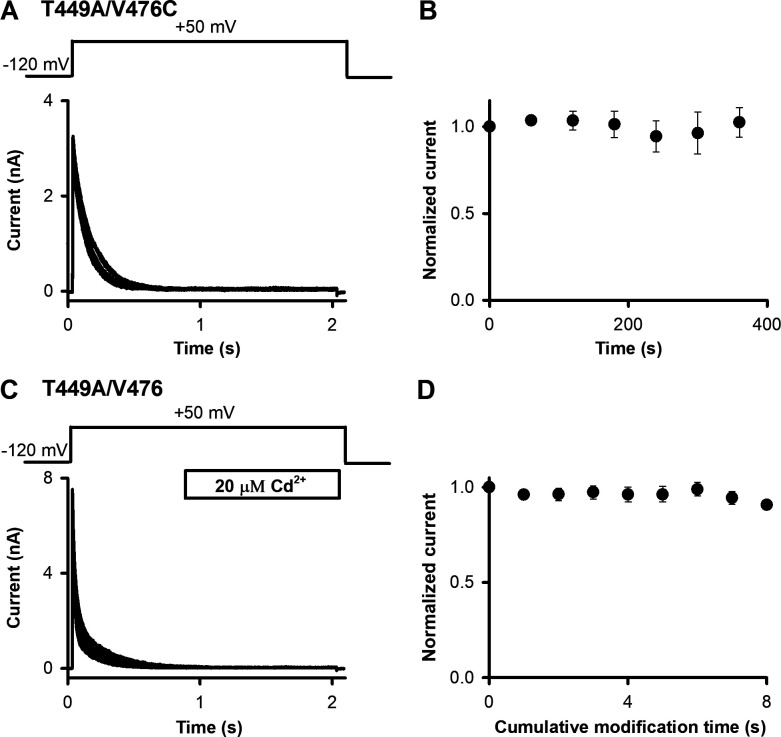
Figure 7.
Control measurements for determining OI→O transition. (A) An inside-out patch pulled from a HEK293 cell expressing T449A/V476C Shaker-IR channels was repeatedly depolarized from a holding potential of −120 mV to +50 mV for 2 s using the pulse protocol shown above the superimposed raw current traces. The ipi was 60 s. (B) The peak current for each pulse was determined and normalized to the peak current of the first pulse, and then these were plotted as a function of the time elapsed from the first depolarizing pulse. (C) For T449A/V476 channels, the same protocol was used as in A, except that the intracellular surface of the patch was exposed to 20 µM Cd2+. The timing (applied to fully inactivated channels 1 s after the depolarization to +50 mV) and the duration (1 s) of the Cd2+ application are indicated by the horizontal bar. (D) Peak currents for each pulse were determined, normalized to the peak current of the first pulse, and plotted as a function of the cumulative exposure time to 20 µM Cd2+. Error bars indicate SEM throughout the figure; n = 5.

