Figure 3.
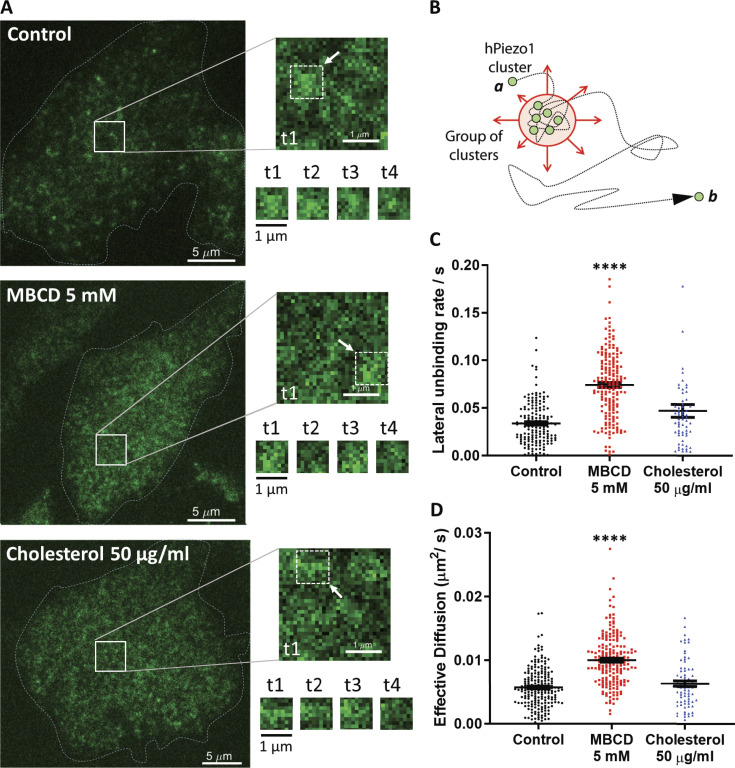
Cholesterol removal alters PIEZO1-GFP dynamics in situ. (A) Left: TIRF images are the initial frames acquired during live-cell imaging. Right: Representative time course of PIEZO1-GFP diffusion dynamics within the highlighted square area, shown next to each of the conditions tested. The four time points (t1–t4) represent the time course of the fluctuations in fluorescence intensity within the 1-µm2 portion of the image indicated by the white arrow, collected at 150-frame intervals (∼5-s intervals between consecutive time points). Scale bars, 5 μM. (B) Cartoon describing the limited diffusion experienced by PIEZO1-GFP channels in the plasma membrane. (C) Quantification of lateral unbinding rate (s−1) of PIEZO1-GFP entities in control (n = 5 trials, 205 cells), 5 mM MBCD-treated (n = 5 trials, 193 cells), and 50 µg/ml cholesterol-treated cells (n = 5 trials, 77 cells). (D) Effective diffusion (µm2/s) of PIEZO1-GFP clusters and group of clusters (fluorescent entities) in control, 5 mM MBCD-, and 50 µg/ml cholesterol-treated cells. Both lateral unbinding rates and effective diffusion are increased significantly by cholesterol depletion via MBCD. Data represent mean ± SEM analyzed with one-way ANOVA; ****, P < 0.00005).

