Figure 5.
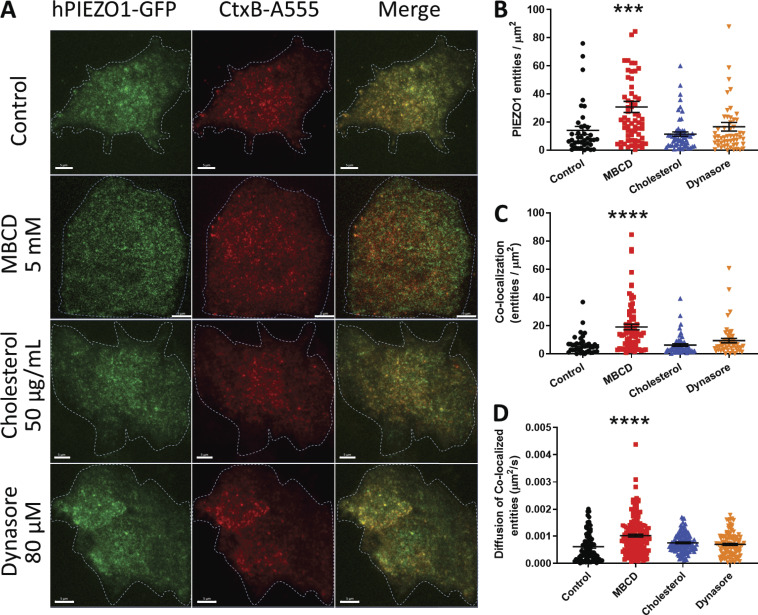
Colocalization of PIEZO1-GFP and CtxB raft marker using TIRF. (A) TIRF microscopy of cholesterol-rich domains labeled with CtxB–Alexa Fluor 555 (A555; red) on the basal membrane of PIEZO1-GFP–expressing HEK293T cells (GFP fluorescence in green). (B) Average number of PIEZO1-GFP entities per square micrometer detected after 30-min treatments. (C) Average density of colocalized entities per square micrometer detected after 30-min treatments. Control (n = 6 trials, 42 cells), MBCD (n = 6 trials, 81 cells), cholesterol (n = 6 trials, 62 cells), and dynasore (n = 6 trials, 55 cells). (D) Effective diffusion rate of colocalized PIEZO1-GFP/CtxB–A555 at the micrometer scale, before and after treatments. Examples of STICCS correlation function time courses are shown in Video 1. One-way ANOVA; ***, P < 0.0005; ****, P < 0.0001; error bars represent SEM. Scale bars represent 5 µm.

