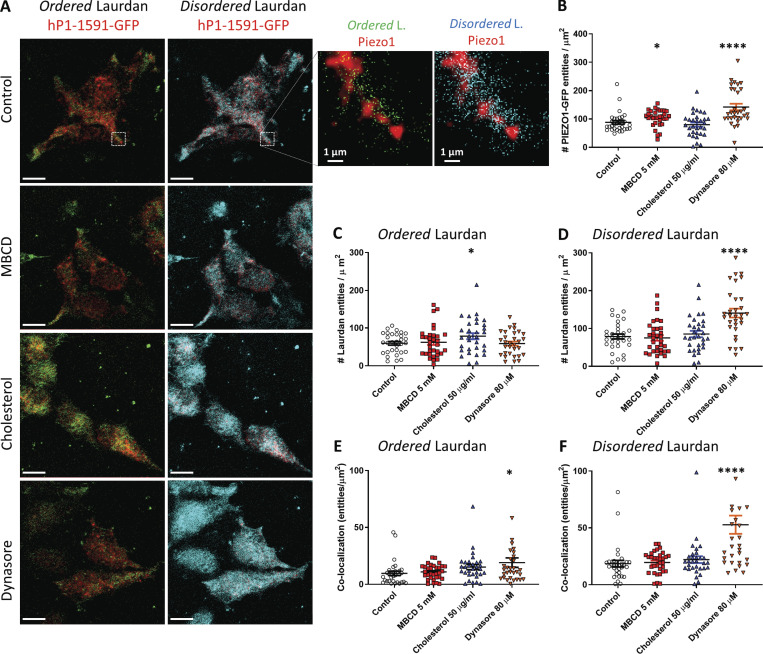
Figure 6.
Colocalization between PIEZO1-GFP and Laurdan phases. (A) Fluorescence microscopy of hP1-1591-CL cells labeled with Laurdan. PIEZO1-GFP (red) is tested for colocalization with either the liquid-ordered phase or the liquid-disordered signals emitted by the Laurdan dye. The images on the left column display the signal emitted by ordered-phase Laurdan (green signal, emission 400–460 nm) and the right column shows the signal emitted by disordered-phase Laurdan (cyan signal, emission 470–530 nm). Scale bars represent 10 µm. The inset on the top right shows a magnified portion of each control image (dashed white box) and highlights the difference in signal intensity and degree of colocalization with PIEZO1-GFP exhibited by either membrane phase labeled by the Laurdan dye. (B) Density of PIEZO1-GFP entities per square micrometer detected under various conditions. (C) Density of ordered Laurdan entities. (D) Density of disordered Laurdan entities. (E) Density of colocalized PIEZO-GFP/ordered Laurdan entities as determined by image correlation spectroscopy. (F) Density of colocalized PIEZO-GFP/disordered Laurdan entities. n = 1 represents data obtained from a single cell. Control PIEZO1-GFP (n = 31 cells), 5 mM MBCD (n = 32 cells), 50 µg/ml cholesterol (n = 31 cells), 80 µM dynasore (n = 31 cells). Statistical analysis was performed using one-way ANOVA; *, P < 0.05; ****, P < 0.0001; error bars represent SEM.

