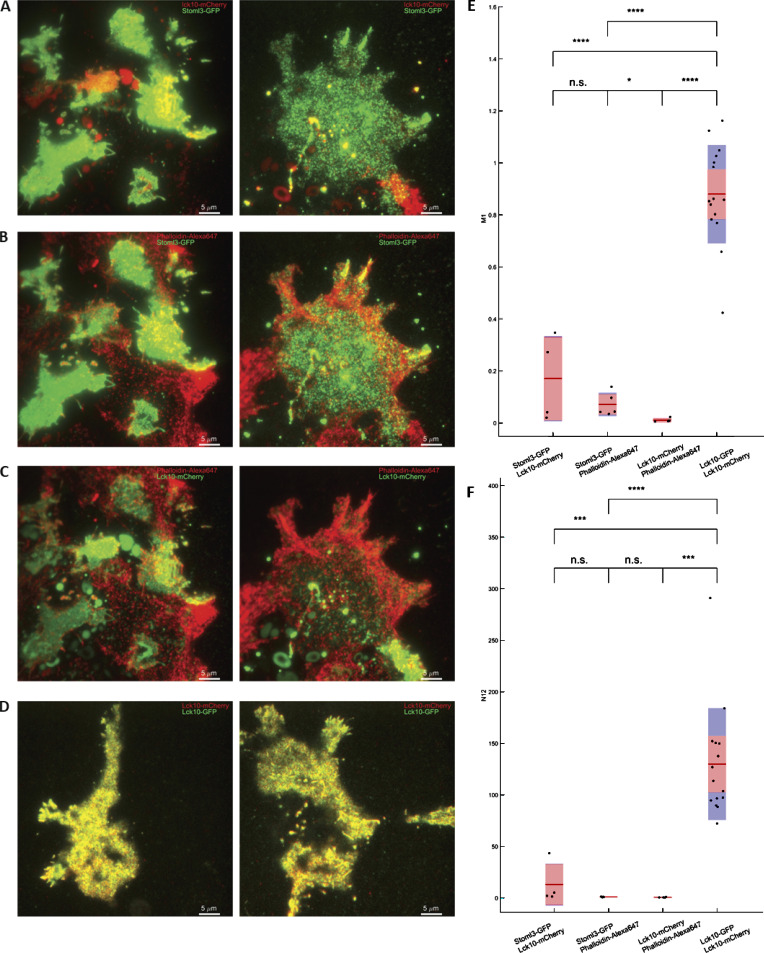
Figure S12.
ICCS control experiments. Controls for ICCS analysis using proteins that mostly do not colocalize compared with doubly stained Lck10-GFP/Lck10-mCherry HEK293T cells. (A) Two membrane markers, Lck10-mCherry and Stoml3-GFP, only marginally colocalize (first column in E and F), likely from their overexpressed presence in plasma membrane. (B and C) Actin stained with phalloidin–Alexa Fluor 647 does not colocalize with Stoml3-GFP (B; second column in E and F), nor does it colocalize with Lck10-mCherry (C; third column in E and F), as expected for actin localization versus membrane markers. (D) HEK293T cells doubly labeled with lck10-mCherry and lck10-GFP showed strong colocalization (last column in E and F) as expected. Red lines in E and F represent median; red and blue zones are SEM and SD. Statistical assessment was performed using one-way ANOVA with multiple comparisons; *, P < 0.05; **, P < 0.005; ***, P < 0.0005; n.s., not significant.

