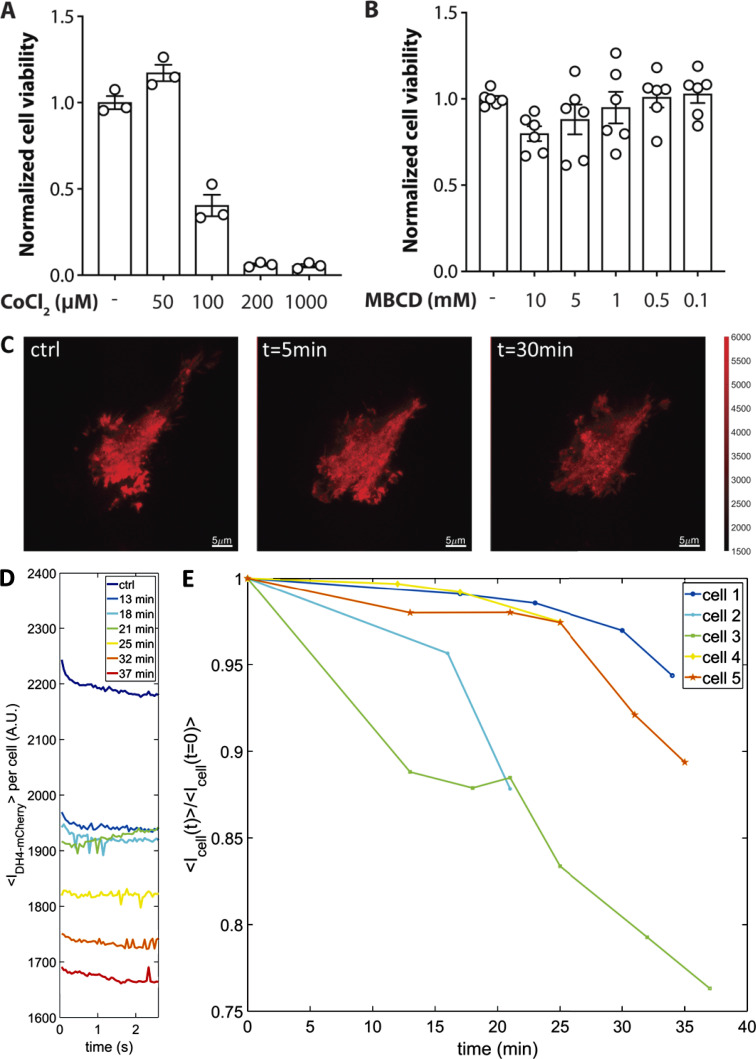
Figure S2.
Effect of MBCD on cell viability and cholesterol levels. (A) Normalized cell viability of PIEZO1-GFP HEK293T cells in the presence and absence of the hypoxia-mimetic CoCl2 as a positive control to see a reduction in viability on cell death. Error bars represent mean ± SEM. (B) Effect of 30-min MBCD pretreatment on cell viability. Error bars represent mean ± SEM. (C) HEK293T cells were transfected with D4H-mCherry, a marker of cholesterol in the plasma membrane, and live-imaged in TIRF mode over 45 min during the 5-mM MBCD treatment (scale bar, 5 µm). (D) D4H-mCherry fluorescence intensity monitored in 2.5-s time blocks. Each colored line represents a consecutive fluorescence recording at different time points for the same cell. (E) Time-course of D4H-mCherry fluorescence, normalized to the average fluorescence intensity at time = 0. Each colored plot represents a separate cell undergoing the 5-mM MBCD treatment.

