Figure S3.
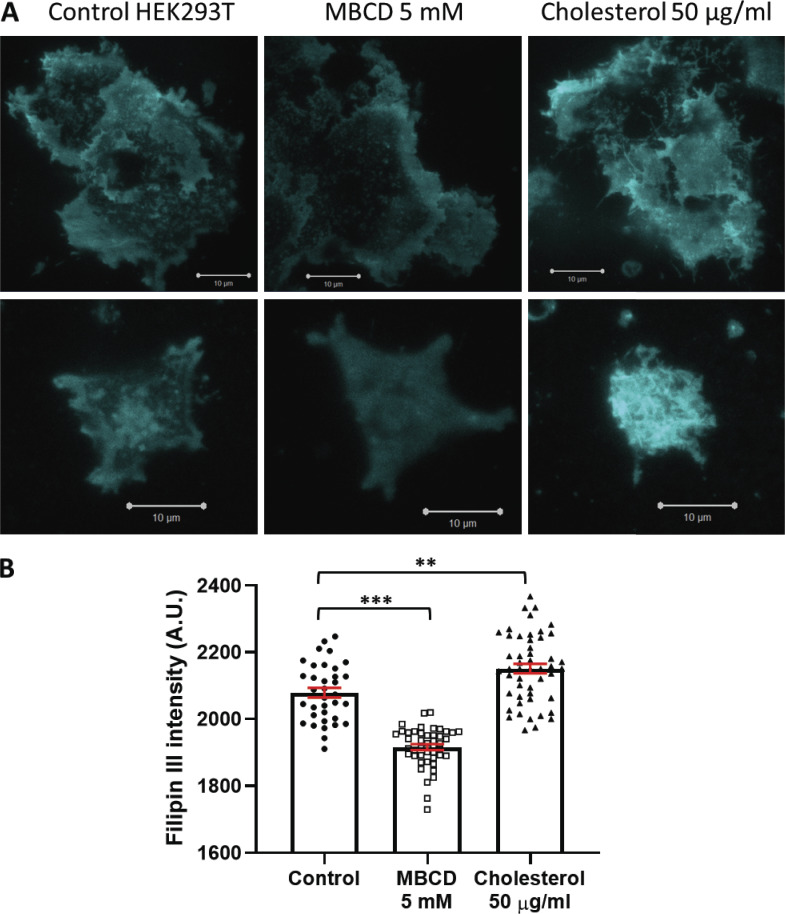
Filipin III staining. (A) TIRF microscopy images of HEK293T cells untreated, cholesterol depleted (5 mM MBCD), or cholesterol enriched (50 µg/ml water-soluble cholesterol). Fields of view including multiple cells are shown on the top row, and images including single, isolated cells on the bottom row. All the images are displayed using the same spectral minimum/maximum values (minimum = 1,600 A.U.; maximum = 3,060 A.U.). Scale bars, 10 μM. (B) Mean fluorescence intensity quantification of Filipin III fluorescence. Intensity calculations were performed using Fiji. A threshold was applied to all images to remove the pixels of intensity <1,600 A.U. before calculating the mean Filipin III intensity (one image represents n = 1). Control (n = 35), MBCD (n = 45), cholesterol (n = 50). Error bars represent mean ± SEM. Statistical comparison performed using one-way ANOVA; **, P < 0.05; ***, P < 0.001.

