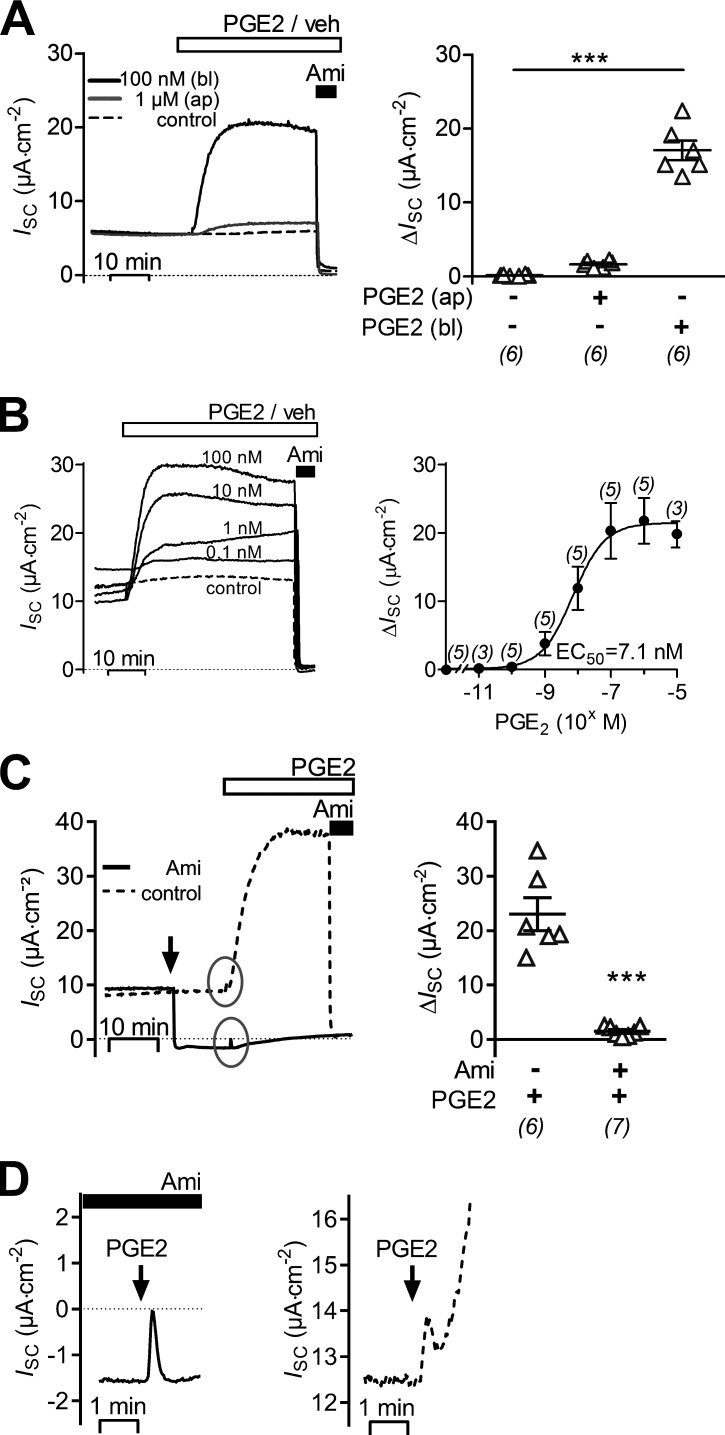
Figure 1.
Basolateral PGE2 stimulates amiloride-sensitive ISC in mCCDcl1 cells. (A–C) Representative traces of continuous ISC recordings from mCCDcl1 cells are shown in the left panels and data from similar experiments are summarized in the corresponding right panels. During the time periods indicated by the open horizontal bar, PGE2 or vehicle (veh) was present. Apical application of 10 µM amiloride (Ami) is indicated by a black horizontal bar. (A) ISC recordings with basolateral PGE2 (bl; 100 nM), apical PGE2 (ap; 1 µM) or vehicle (control) are represented by a black, gray, or dashed line, respectively. (B) ISC recordings are shown with basolateral application of PGE2 (black lines) in concentrations from 0.1–100 nM or with vehicle (dashed line). A nonlinear fit for the ISC response upon PGE2 application in concentrations of 10 pM to 10 µM was used to estimate EC50. (C) Basolateral PGE2 (100 nM) was applied in the absence (control; dashed line) or presence of 10 µM amiloride (black line). Arrow indicates time point of apical addition of amiloride or vehicle (control). In the control PGE2 recording, apical amiloride (10 µM) was added at the end of the experiment. To summarize data from different experiments as ΔISC values, the individual ISC values were corrected by subtracting the corresponding baseline ISC value. Gray circles highlight the initial phases of the ISC responses to PGE2. Summary data (right panels) are presented as individual data points and/or mean values ± SEM. Numbers of experiments are given in parenthesis. Statistical analysis was determined using one-way ANOVA with Tukey's multiple comparison test or Student’s t test where appropriate; ***, P < 0.001. (D) The initial phases of the responses to basolateral PGE2 encircled in C are shown enlarged using expanded scales. Arrows indicate the time point of PGE2 application in the continuous presence (black bar, left panel) or absence (right panel) of amiloride.

