Figure 2.
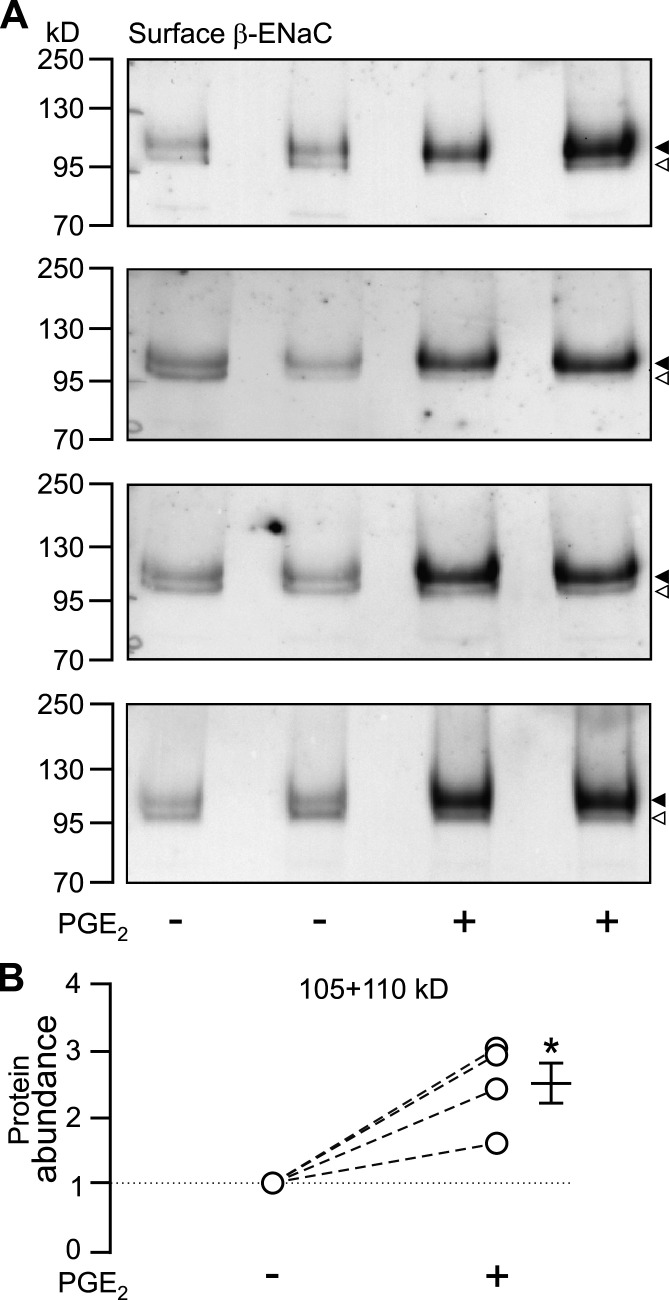
PGE2 elevates the abundance of β-ENaC at the cell surface. (A) β-ENaC was detected by Western blot analysis using biotinylated cell surface proteins isolated from mCCDcl1 cells exposed on the basolateral side for 30 min to 100 nM PGE2 (+) or vehicle (−). The four blots represent data from four individual experiments using two filters of mCCDcl1 cells per experimental group. Arrowheads to the right of the blots indicate band sizes of ∼110 kD (filled) and ∼105 kD (open) as expected for glycosylated and nongylcosylated β-ENaC. (B) The blots shown in A were analyzed by densitometry, and the signals of the lower and upper bands of each lane were combined (105 + 110 kD). In each experiment, two matched mCCDcl1 samples were used per group (± PGE2) and an average value was determined for each group. For each experiment, the average value from the PGE2-treated cells was normalized to the average value of the nontreated cells (corresponding values are connected by a dashed line). The mean ± SEM value represents the average change in protein abundance compared with vehicle treatment. Statistical analysis was performed using Student's t test; *, P < 0.05 versus solvent vehicle controls.

