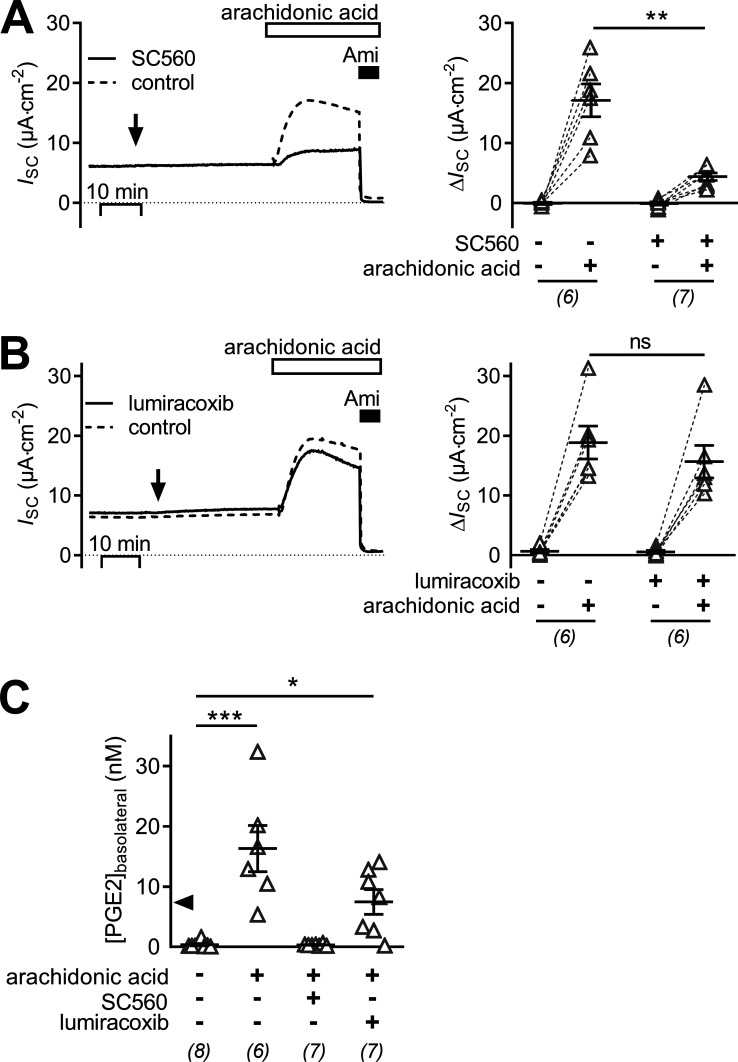
Figure 8.
Stimulation of ENaC in mCCDcl1 cells by arachidonic acid requires COX-1 activity. (A and B) Representative traces of continuous ISC recordings from mCCDcl1 cells are shown in the left panels, and data from similar experiments are summarized in the corresponding right panels. At the time point indicated by an arrow, cells were exposed to 0.14 µM SC560 (COX-1 selective inhibitor, solid line) or vehicle in matched control recordings (A; control, dashed line) or 2 µM lumiracoxib (COX-2 selective inhibitor, solid line) or vehicle in matched control recordings (B; control, dashed line). Approximately 30 min later, all cells were exposed to 50 µM apical arachidonic acid and subsequently to apical amiloride (Ami; 10 µM) as indicated. Summary data (right panel) are presented as ΔISC values, which were determined by subtracting the corresponding baseline ISC from the ISC reached in the presence (+) or absence (−) of SC560, lumiracoxib, and arachidonic acid as indicated. (C) Concentration of PGE2 measured in basolateral cell culture medium collected from cells in the presence (+) or absence (−) of 50 µM arachidonic acid, 0.14 µM SC560 and 2 µM lumiracoxib as indicated. The solid arrowhead indicates the EC50 value for the ISC response upon PGE2 as determined in Fig. 1. Data are presented as individual values and their mean ± SEM. Numbers of experiments are given in parentheses. ***, P < 0.001; **, P < 0.01; *, P < 0.05; ns, P ≥ 0.05, one-way ANOVA with Dunn's multiple comparison test.

