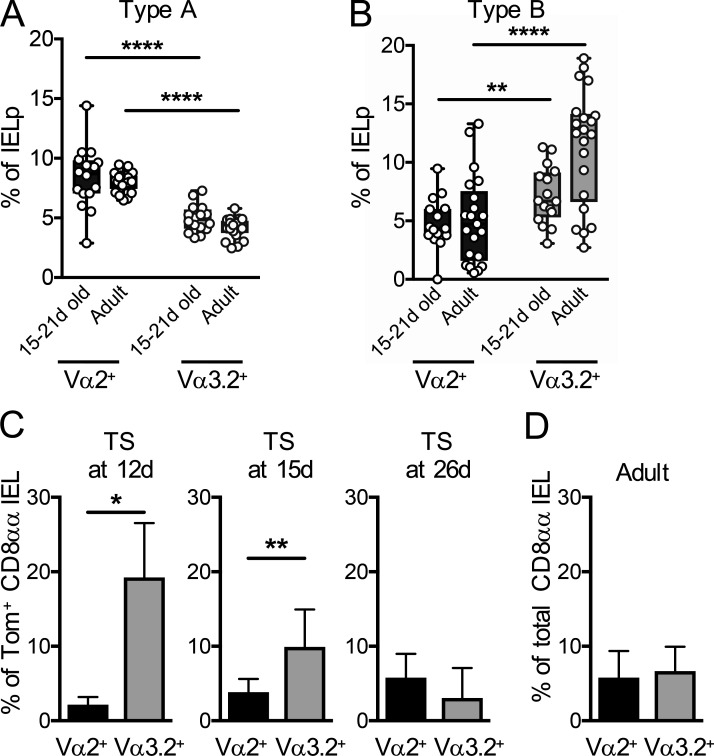
Figure 4.
Distinct TCR Vα usage in CD8αα IELs time-stamped in early life. (A and B) Type A (A) and type B (B) IELps were analyzed by flow cytometry for expression of the TCR Vα2 and Vα3.2 chains in 15–21-d-old and adult Tbx21GFP or C57BL/6 mice. (C) Cd4CreERT2×Rosa26tdT mice were time-stamped by intraperitoneal injection of tamoxifen or 4-OHT at various ages. Time-stamp–labeled Tomato+ small intestinal CD8αα IELs were analyzed 4–5 wk later by flow cytometry for expression of Vα2 and Vα3.2. (n = 3 [12 d and 26 d]; n = 8 [15 d]). (D) Cd4CreERT2×Rosa26tdT mice were time-stamped by intraperitoneal injection of 4-OHT at ages between 10 and 15 d. 4–5 wk later, the total combined Tomato+ and Tomato− small intestinal CD8αα IELs were analyzed for expression of Vα2 and Vα3.2 (n = 9). Each symbol in A and B represents an individual recipient, and the graphs are pooled from 10 independent experiments; they show median (center lines) with 25th and 75th percentiles (box limits). The whiskers indicate the smallest and largest values. Data in C and D are pooled from at least two independent experiments and show the mean ± SD. *P < 0.05, **P < 0.01, and ****P < 0.0001 (Student’s t test). TS, time-stamped.

