Figure 2.
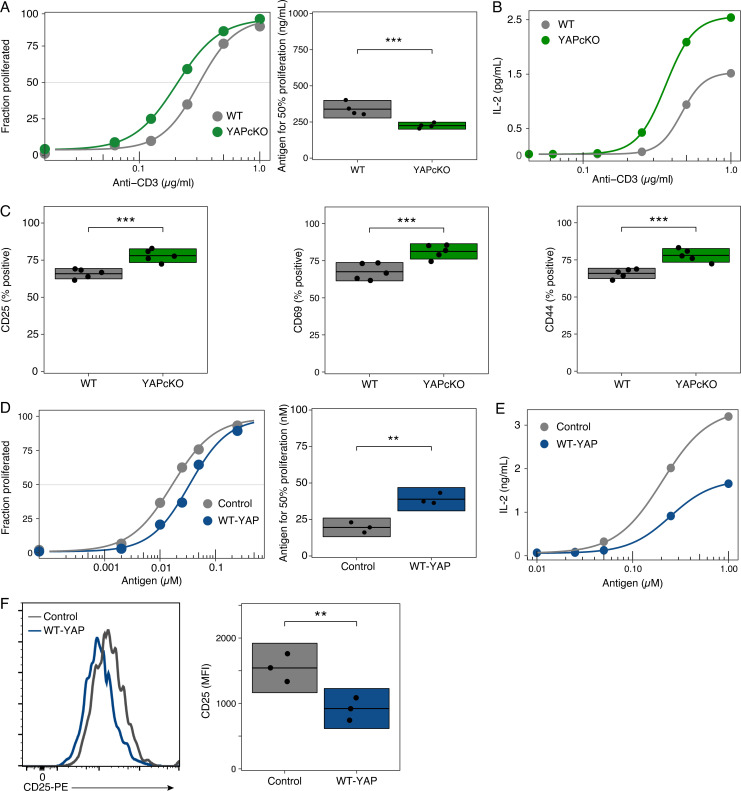
YAP restrains T cell proliferation and effector function. (A) Proliferation (left) of CFSE-labeled WT (gray) or YAPcKO (green) T cells after anti-CD3 and anti-CD28 stimulation. ED50 calculated from four independent dose–response experiments shown (right). Box shows mean and 95% CI. (B) IL-2 secretion of WT or YAPcKO T cells at 72 h after activation with anti-CD3 and anti-CD28 stimulation. Data representative of three independent experiments. (C) Activation markers of WT or YAPcKO T cells stimulated with 1 µg/ml anti-CD3 for 24 h. Data from five independent experiments are shown. Box shows mean and 95% CI. (D) Proliferation of CellTrace Violet–labeled OT-II YAPcKO T cells transduced with control vector (gray) or WT-YAP (blue) after restimulation with WT splenocytes and OVA peptide 323–339. ED50 calculated from three independent dose–response experiments shown (right). Box shows mean and 95% CI. (E) IL-2 secretion of OT-II YAPcKO T cells transduced with control vector (gray) or WT-YAP (blue) at 48 h after restimulation with OVA peptide. Data representative of two independent experiments. (F) CD25 expression of restimulated T cells from experiment in E. Data from three independent experiments are shown. Box shows mean and 95% CI. Permutation P values: **, P < 0.01; ***, P < 0.001.

