Figure 3.
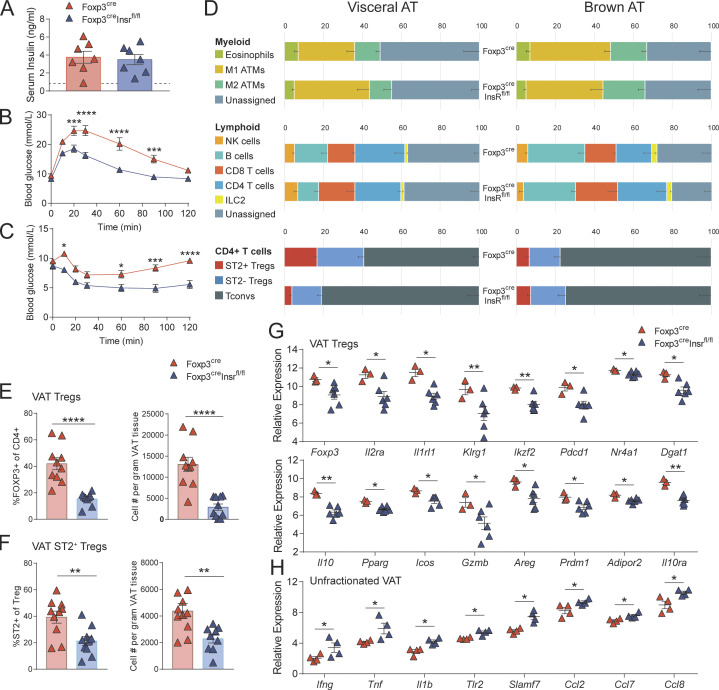
Foxp3creInsrfl/fl mice are protected from age-associated metabolic syndrome. Male Foxp3cre and Foxp3creInsrfl/fl mice were fed NCD, and metabolic parameters were measured in 52–60-wk-old mice. (A) Fasting serum insulin levels. Dashed line represents mean serum insulin levels of healthy, young (16-wk-old) mice (n = 7 per group). (B and C) GTTs (B) and ITTs (C). (D) Flow cytometric immune profiling of VAT and BAT; gating shown in Fig. S2. ATMs, adipose tissue macrophages. Numbers are the mean of n = 10 per group. Significant difference (P < 0.01) between Foxp3cre and Foxp3creInsrfl/fl mice in VAT: T regs and ST2+ T regs. (E and F) Proportion and absolute numbers in VAT of T regs within CD4+ T cells (E) and ST2+ cells within T regs (F). (G and H) Gene expression by nanoString in sorted VAT T regs (G) or unfractionated VAT (H; n = 3–6 per group). Significance was determined by Student’s t test (A and D–F), Mann–Whitney U test (G and H), or two-way repeated-measures ANOVA with Bonferroni’s test (B and C). Data shown as mean ± SEM; for B–F, n = 10 per group from two independent experiments. *, P < 0.05; **, P < 0.01; ***, P < 0.001; ****, P < 0.0001.

