Figure 6.
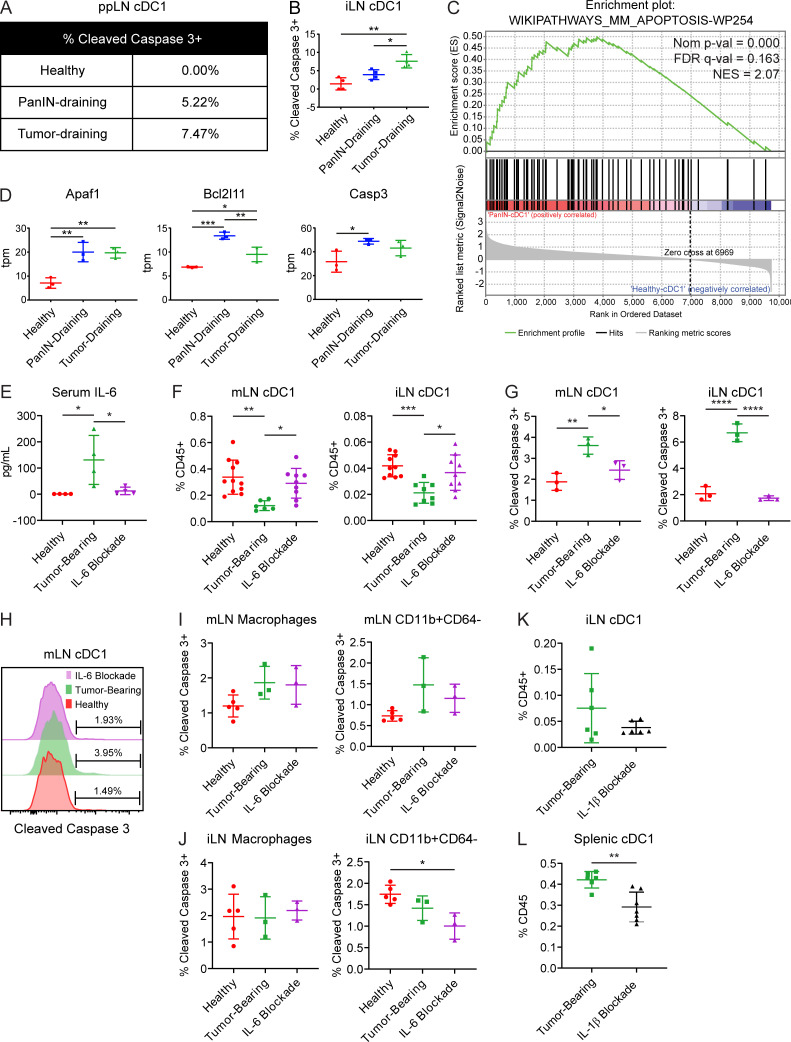
Increased serum IL-6 drives cDC1 apoptosis systemically in tumor-bearing KPC mice. (A and B) Percentage of (A) ppLN and (B) iLN cDC1s positive for expression of active cleaved caspase-3 in healthy, PanIN-bearing, and tumor-bearing mice. (C) Enrichment plot of apoptosis gene set in cDC1s from PanIN-draining versus healthy ppLNs. FDR, false discovery rate; NES, normalized enrichment score. (D) Expression of select genes in tpm reads from the gene set shown in C. (E) Serum IL-6 levels as determined by cytokine bead array in healthy mice, tumor-bearing mice, and tumor-bearing mice treated with IL-6–neutralizing antibody (MP5-20F3). (F) Enumeration of cDC1s in the mLN and iLN. (G) Percentage of mLN and iLN cDC1s positive for expression of cleaved caspase-3. (H) Representative histogram of cleaved caspase-3 expression in mLN cDC1s from G. (I and J) Percentage of CD64+F4/80+ macrophages and CD64−CD11b+ myeloid cells positive for expression of cleaved caspase-3 in the (I) mLN and (J) iLN. (K and L) Quantification of cDC1s as a percentage of live CD45+ cells in (K) iLN cDC1s and (L) splenic cDC1s from tumor-bearing KPC mice treated with IL-1β blocking monoclonal antibody (AF-401-NA). Samples pooled across at least four mice per treatment group in A. (C and D) Each sample consists of total RNA collected from 10,000 sorted ppLN cDC1s pooled across three to six mice. Error bars indicate mean ± SD. ****, P < 0.0001; ***, P < 0.001; **, P < 0.01; *, P < 0.05 (one-way ANOVA with Tukey’s HSD post-test in B, D, E–G, I, and J; two-tailed Student’s t test in K and L). Data shown are representative of at least two independent experiments with at least three mice per group.

