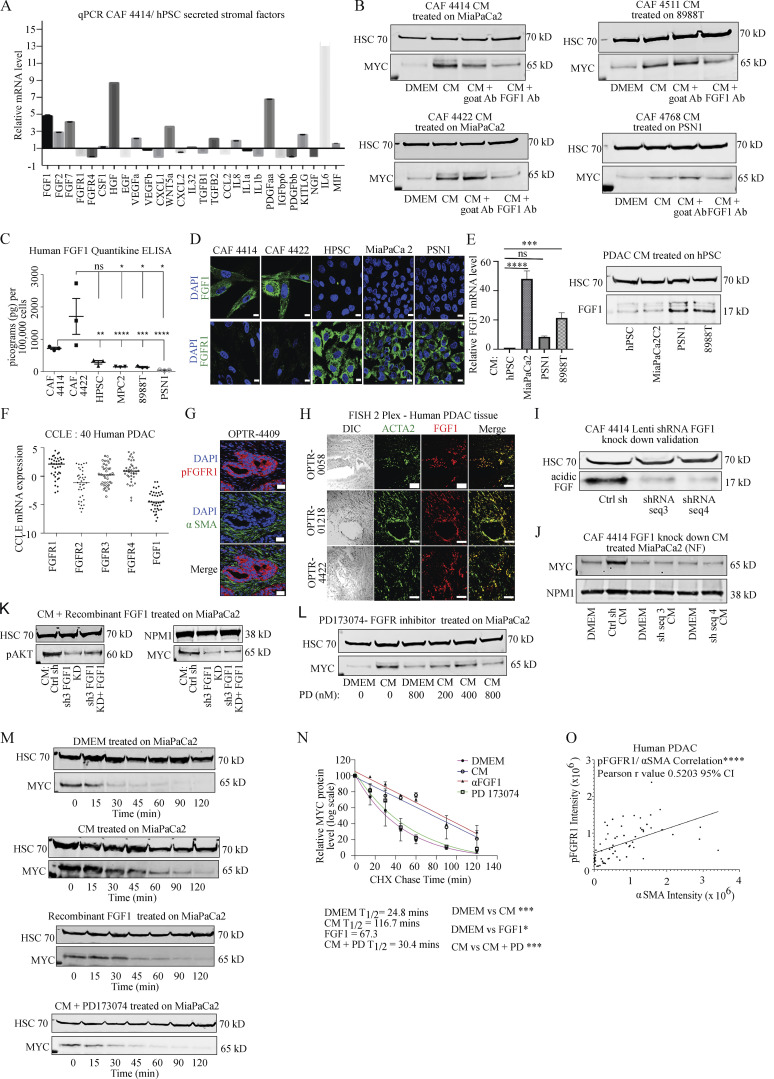
Figure 2.
Stroma-derived FGF1 is necessary and sufficient for paracrine regulation of MYC. (A) qRT-PCR for the indicated secreted factors in CAF 4414 and hPSC (n = 3 independent experiments). Data are plotted as fold change in CAF 4414 compared with hPSC (set to 1); all values were normalized to 36B4 as a housekeeping gene. (B) CAF CM was incubated alone or with FGF1 neutralizing antibody or goat IgG control antibody for 1 h at room temperature, then added to PDAC cells for 3 h. MYC levels in nuclear extracts were analyzed by Western blot (representative of three independent experiments). (C) ELISA for FGF1 in CM from the indicated cell lines. Data are presented as mean ± SEM; *, P < 0.05; **, P < 0.0025; ***, P < 0.001; ****, P < 0.0001 by Student’s t test (n = 3 independent experiments) compared with CAF 4422 CM (upper line and asterisks) or CAF 4414 CM (lower line and asterisks). (D) IF staining for FGF1 or FGFR1 in the indicated cell lines. Scale bar, 10 µm. (E) hPSCs were treated with CM from the indicated PDAC cell lines for 24 h, and FGF1 mRNA was measured by qPCR (left; data were normalized to 36B4 and are presented as mean ± SEM; ***, P < 0.001; ****, P < 0.0001 by Student’s t test) and protein measured by Western blot (right). Results represent three independent experiments. (F) mRNA expression levels of the four FGFRs and FGF1 in 40 human PDAC cells from the Cancer Cell Line Encyclopedia database. (G) Fluorescent immunostaining for pFGFR1 in human PDAC samples (representative of n = 3 patient samples). Scale bar, 20 µm. (H) RNA-FISH for ACTA2 (encoding αSMA) and FGF1 in human PDAC (representative of n = 6 patient samples). Scale bar, 50 µm. Differential interference contrast (left column) shows tissue context. (I) Western blots showing FGF1 knockdown in CAF 4414 knockdown lines (scramble control versus two distinct shFGF1 sequences). (J) Western blot for MYC in MiaPaCa2 cells after treatment with DMEM or CM from the indicated CAF 4414 line for 3 h (representative of n = 3 independent experiments). (K) Western blot for pAKT in MiaPaCa2 cells treated with CAF 4414 control CM, shFGF1 CM, or shFGF1 CM + 50 pg/ml human FGF1 for 3 h. Results represent three independent experiments. (L) Western blot for MYC in MiaPaCa2 cells after treatment with DMEM or CM ± FGFR inhibitor PD173074 at the indicated concentrations for 3 h (representative of n = 3 independent experiments). (M) MiaPaCa2 cells were treated with DMEM or 50 pg/ml FGF1 or CAF 4414 CM for 3 h, then treated with cycloheximide ± 800 nM PD173074 for the indicated duration, and MYC levels were analyzed by Western blot. (N) Quantification of MYC levels in M (n = 3 independent experiments). P value reflects comparison of t1/2 from three independent experiments; *, P < 0.05; ***, P < 0.001 by Student’s t test. (O) Quantification of fluorescent immunostaining of human PDAC patient tissue samples indicating integrated density of pFGFR1 in KRT+ cells and αSMA in 63 fields of view from n = 5 human PDAC specimens; ****, P < 0.0001 for Pearson’s correlation. Ab, antibody; ns, not significant; PD, PD173073.

