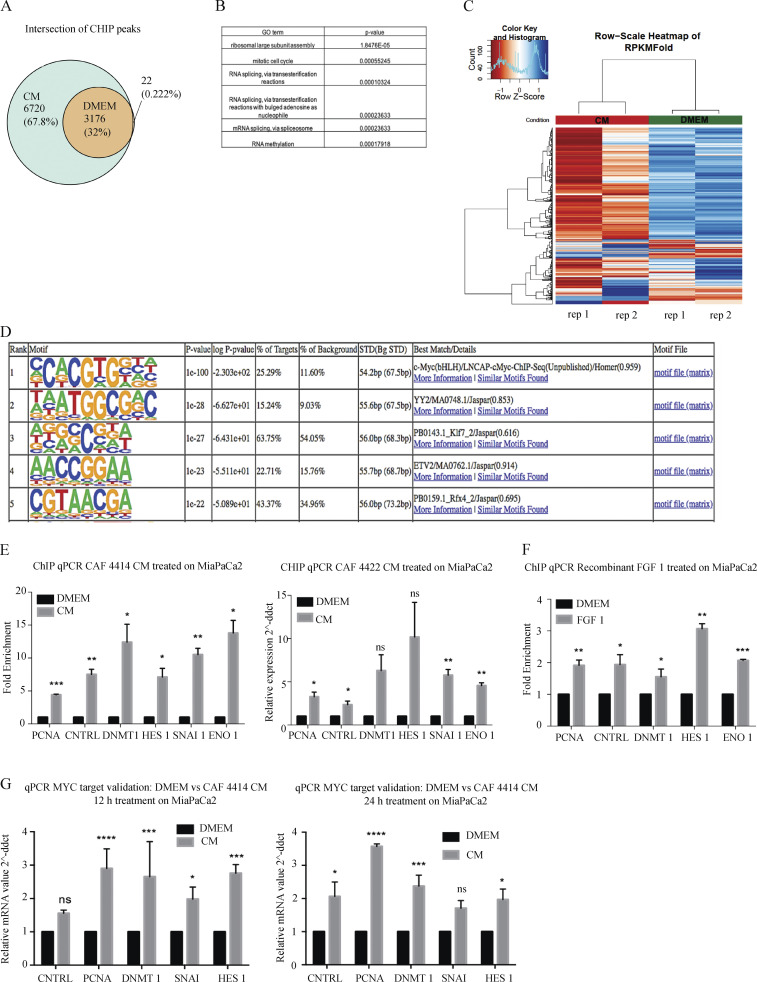
Figure 4.
Stromal stimulation alters MYC chromatin occupancy and target gene expression. (A) Venn diagram showing overlap of significant MYC-bound peaks from ChIP-seq in MiaPaCa2 cells treated with DMEM or CAF 4414 CM for 3 h (n = 2 biological replicates). (B) Gene ontology (GO) terms enriched among differentially bound loci by ChIP-seq (significantly enriched among CM-restricted binding sites). (C) Heatmap showing hierarchical clustering of MYC binding sites identified under both DMEM and CM conditions by ChIP-seq as described in A. (D) Results of HOMER analysis of top motifs among bound regions in MYC ChIP-seq (assessing all bound peaks, including DMEM and CM treatments). (E) ChIP-qPCR for MYC binding sites in the indicated differentially bound promoters, as determined by ChIP-seq, in MiaPaCa2 cells treated with DMEM or CAF 4414 CM or CAF 4422 CM for 3 h (n = 2 independent experiments). (F) ChIP-qPCR for MYC binding sites in the indicated differentially bound promoters, as determined by ChIP-seq, in MiaPaCa2 cells treated with DMEM or 50 pg/ml FGF1 for 3 h (n = 2 independent experiments). (G) qRT-PCR for the indicated genes in MiaPaCa2 cells treated for 12 h or 24 h with CAF 4414 CM. Results were normalized to 36B4 as a housekeeping gene (n = 3 independent experiments). For E–G, *, P < 0.05; **, P < 0.01; ***, P < 0.001; ****, P < 0.0001 by Student’s t test. ns, not significant; ddct, ΔΔcycle threshold; STD, standard.

