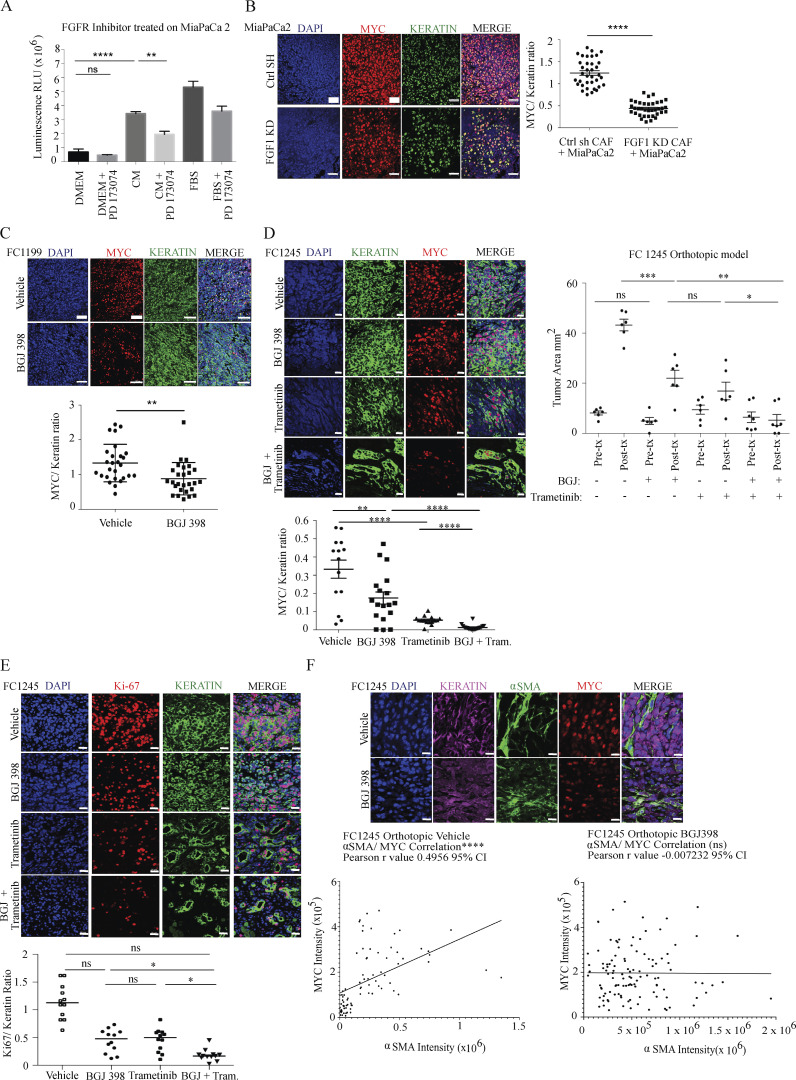
Figure 5.
The FGF1/FGFR axis regulates MYC levels and PDAC growth in vivo. (A) Proliferation assay for MiaPaCa2 cells treated with CAF 4414 CM ± PD173074 (800 nM) for 72 h. **, P < 0.01; ****, P < 0.0001 by one-way ANOVA (n = 3 biological replicates). (B) Fluorescent immunostaining of cotransplanted subcutaneous xenografts. Scale bar, 50 µm. Quantification appears to the right to determine the ratio of MYC intensity within KRT+ cells over KRT signal. 36 fields of view were analyzed from n = 5 mice per condition. (C) Left: Fluorescent immunostaining of orthotopic transplants of FC1199 cells treated with vehicle or BGJ 398. Quantification appears below to determine the ratio of MYC intensity within KRT+ cells over KRT signal. 28 fields of view were analyzed from n = 3 mice per condition. For B and C (left), **, P < 0.01; ****, P < 0.0001 by Student’s t test. Scale bar, 50 µm. Right: Fluorescent immunostaining of orthotopic transplants of FC1245 cells from the indicated treatment groups. Quantification appears below to determine the ratio of MYC intensity within KRT+ cells over KRT signal (n = 3 mice per group, six fields imaged per mouse). **, P < 0.01; ****, P < 0.0001 by one-way ANOVA. Scale bar, 20 µm. (D) Tumor measurements by high-resolution ultrasound at the indicated time points in FC1245 orthotopic transplants (vehicle, BGJ 398, trametinib: n = 6; BGJ 398 + trametinib, n = 7). *, P < 0.05; **, P < 0.01; ***, P < 0.001; ****, P < 0.0001 by one-way ANOVA. (E) Fluorescent immunostaining of Ki67 in orthotopic transplants of FC1245 cells from the indicated treatment groups. Quantification appears below to determine the ratio of Ki67 intensity within KRT+ cells over KRT signal (n = 3 mice per group, four fields imaged per mouse). *, P < 0.05 by one-way ANOVA. Scale bar, 20 µm. (F) Fluorescent immunostaining of KRT, MYC, and αSMA in orthotopic FC1245 tumors treated with vehicle or BGJ 398. Quantification of MYC integrated density in KRT+ cells and of αSMA integrated density appear below in 80 fields of view from n = 5 vehicle samples, and 114 fields of view from n = 8 BGJ 398 samples; ****, P < 0.0001 for Pearson’s correlation. Scale bar, 10 µm. ns, not significant.

