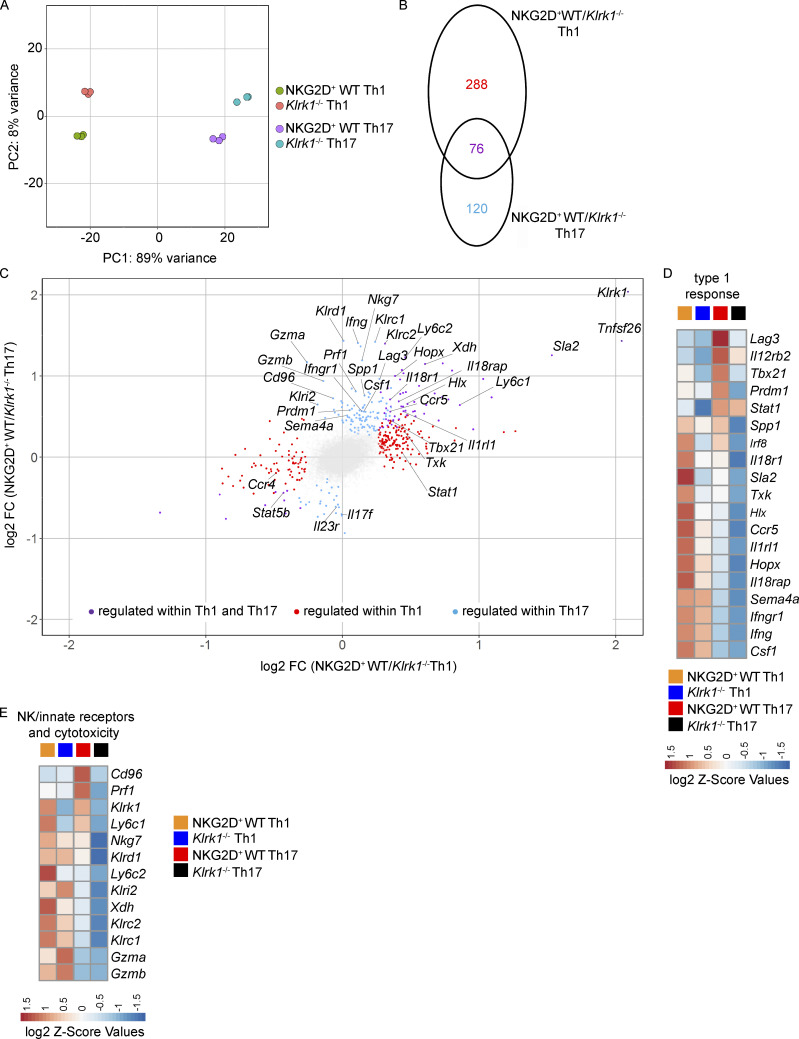
Figure 3.
NKG2D is associated with reinforced type 1 response gene signature in in vitro–generated Th1 and Th17 cells. (A–E) Transcriptome analysis of Th1 and Th17 (IL-1β, -6, -23, and IL-12*) cells sorted as NKG2D+ or Klrk1−/−. (A) Principal component analysis of Th cell subsets based on differentially expressed genes for each of the comparisons (filtered for padj < 0.05, Mann–Whitney U test). Each dot represents an independent culture (n = 3). (B and C) Venn diagram showing number of transcripts (filtered for padj < 0.05; B) and scatter plot showing transcripts of genes differentially expressed in NKG2D+ and Klrk1−/− cells (filtered for padj < 0.05 and FC >1.2; C) preferentially in Th1 (red), Th17 (blue), or both Th1 and Th17 lineages (purple). Gray dots represent the genes below the selected threshold. (D and E) Z-score heat maps showing relative expression of selected genes in the four T cell subsets. Selected genes are filtered for padj < 0.05 and FC >1.2 in at least one comparison.

