Figure 8.
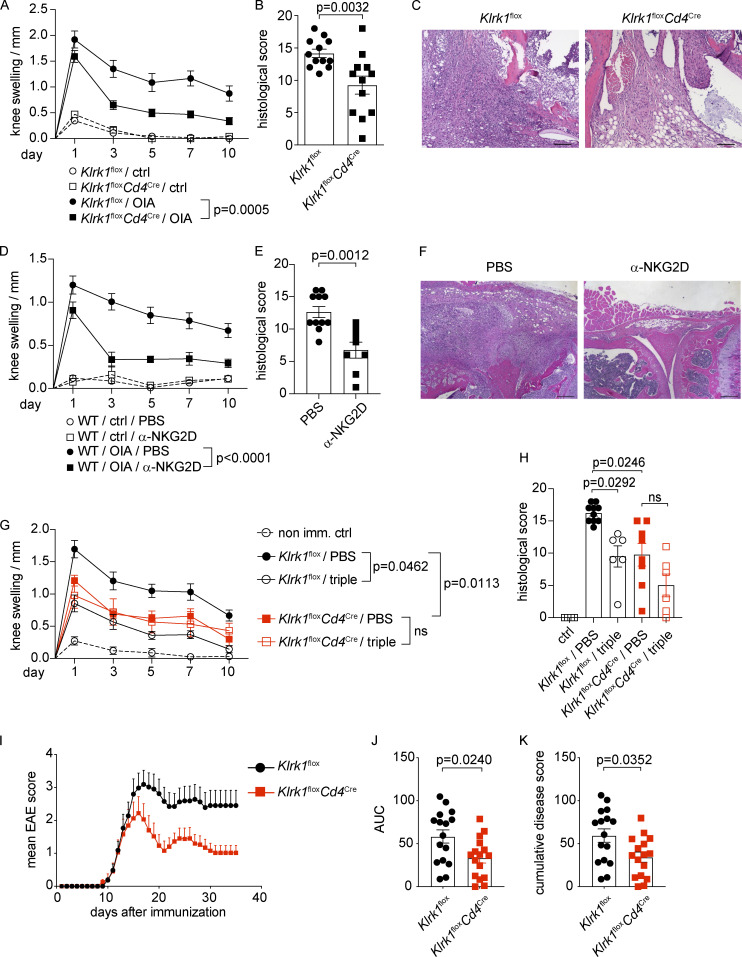
NKG2D promotes immunopathology in antigen-induced arthritis and EAE. (A–H) C57BL/6, Klrk1flox or Klrk1floxCd4Cre were s.c. immunized with catOVA/CFA. Disease was induced with i.a. injection of catOVA (OIA). Control animals received only i.a. injection of catOVA (ctrl). (A) Knee swelling measurement analysis at indicated time points after induction of the disease (n = 12). (B) Disease score analysis in arthritis-induced mice 10 d after induction of the disease (n = 12); Mann–Whitney U test. (C) Representative H&E staining of the knee joint area. Scale bar 100 µm. (D and E) Knee swelling measurement analysis (D) and disease score analysis (E) in PBS-treated (n = 11) or α-NKG2D blocking antibody–treated (n = 8) arthritis-induced C57BL/6 mice 10 d after induction of the disease; Mann–Whitney U test. (F) Representative H&E staining of the knee joint area. Scale bar 200 µm. (G and H) Knee swelling measurement analysis (G) and disease score analysis (H) in PBS-treated or α-IL-17A/α-GM-CSF/α-IFN-γ blocking antibody–treated arthritis-induced Klrk1flox (n = 10/6) or Klrk1floxCd4Cre (n = 8/6) mice; Kruskal–Wallis test with multiple comparison test. In A, D, and G: ctrl, nonimmunized mice; OIA, OVA/CFA immunized (imm.) mice; value for each individual mouse is a difference in the knee thickness between the injected and noninjected knee. Data show mean ± SEM, pooled from at least two independent experiments. Two-way ANOVA with multiple comparison test. ns, not significant. In B, E, and H, each symbol represents an individual mouse; lines represent mean ± SEM. Data are pooled from at least two individual experiments. (I–K) Clinical scores of EAE in Klrk1flox or Klrk1floxCd4Cre mice (n = 16), Mann–Whitney U test. AUC, area under the curve. Data are pooled from three independent experiments.

