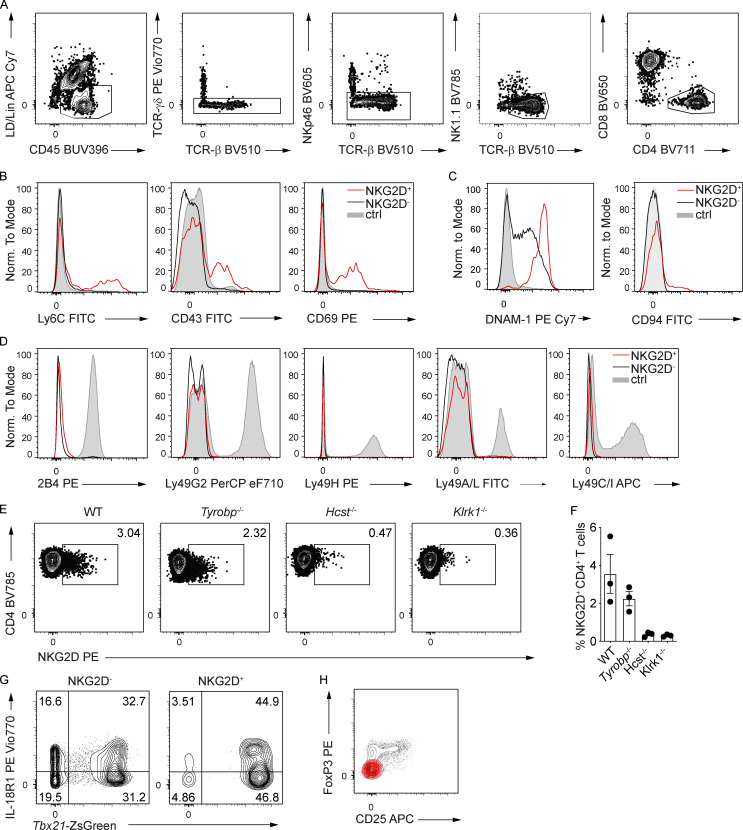
Figure S1.
NKG2D is expressed on antigen-experienced CD4+ T cells in steady-state C57BL/6 mice. (A) FC gating strategy for the characterization of NKG2D+ CD4+ T cells in C57BL/6 mice (spleen shown). Lineage (Lin) includes CD19, FcεRI, Gr-1, and F4/80. (B) Representative FC analysis of indicated surface marker expression on NKG2D+ (red line) and NKG2D− (black line) CD44+ CD4+ T cells in the spleen. Shaded histogram represents live CD19+ cells (n = 3). (C) Representative FC analysis of DNAM-1 and CD94 expression on splenic CD4+ CD44+ NKG2D− (black line) and CD4+ CD44+ NKG2D+ (red line). Shaded histogram represents live CD19+ cells (n = 6). (D) FC analysis of selected surface marker expression on NKG2D+ (red line) and NKG2D− (black line) CD44+ CD4+ T cells in spleen. Shaded histogram represents NK cells (n = 3). (E) Representative FC analysis of NKG2D expression on CD44+ CD4+ T cells from spleen of WT, Tyrobp−/−, Hcst−/−, and Klrk1−/− mice. (F) Frequency of NKG2D+ CD44+ CD4+ T cells, quantification of E. Each symbol represents a mouse; line represents the mean ± SEM (n = 3). Data are pooled from two independent experiments. (G) Representative FC analysis of indicated marker expression on NKG2D+ and NKG2D− CD44+ CD4+ T cells in the siLP of Tbx21-ZsGreen mice (n = 3). (H) Representative FC analysis of FoxP3 and CD25 expression on NKG2D+ (red) and NKG2D− (gray) CD4+ T cells from the spleen of WT mice (n = 3). In A–D, G, and H, data are representative of at least two independent experiments.

