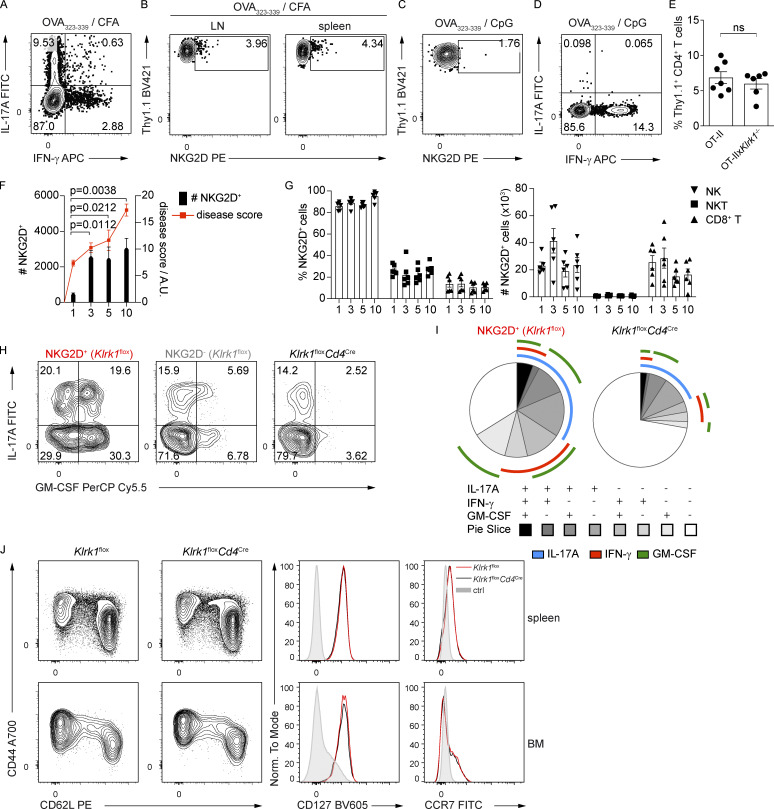
Figure S4.
NKG2D modulates the cytokine production in CD4+ T cells in vivo and promotes immunopathology in antigen-induced arthritis. (A) Representative FC analysis of intracellular cytokine expression in transferred OT-II cells, from draining lymph nodes of recipient mice at day 6 after immunization with OVA323–339/CFA and after restimulation with PMA/Iono (n = 7). Data are representative of two independent experiments. (B) Representative FC analysis showing NKG2D expression on transferred WT OT-II+ CD4+ T cells 6 d after OVA323–339/CFA immunization, n = 7. Data are representative of two independent experiments. (C and D) Representative FC analysis of NKG2D expression (C) and intracellular cytokine expression (D) in OT-II+ CD4+ T cells in dLN after OVA323–339/CpG immunization (n = 5). Data are representative of two independent experiments. (E) Frequency of recovered OT-II and OT-IIxKlrk1−/− transferred cells, from dLN of recipient mice at day 6 after immunization with OVA323–339/CFA. Data show mean ± SEM; n = 7 (OT-II) and 6 (OT-IIxKlrk1−/−). ns, not significant. Data are pooled from two independent experiments. (F) Graph representing absolute numbers of NKG2D+ CD40L+ CD4+ T cells (black bars) in the dLN of mice and histological disease score (red dots) in the knee joints of mice at indicated time points after arthritis induction. Bar graph data are mean ± SEM (n = 6), Kruskal–Wallis test; red line connects means of score values (n = 6). Data are pooled from two independent experiments. A.U., arbitrary units. (G) Frequency and absolute numbers of NKG2D-expressing cells analyzed on indicated cell subsets from dLN during the course of OIA; data represent mean ± SEM; n = 6 for each time point. Data are pooled from two independent experiments. (H) Representative FC analysis of intracellular cytokine expression in OVA-restimulated NKG2D+ and NKG2D− CD40L+ CD4+ T cells in Klrk1flox mice and CD40L+ CD4+ T cells in Klrk1floxCd4Cre mice from dLN at day 10 after the OIA induction. Data are representative of three independent experiments. (I) SPICE charts depict combinatorial expression of IL-17A, IFN-γ, and GM-CSF in NKG2D+ CD40L+ CD4+ T cells in dLN of Klrk1flox mice and CD40L+ CD4+ T cells in Klrk1floxCd4Cre mice, at day 10 after OIA induction (n = 9, Klrk1flox; n = 7, Klrk1floxCd4Cre). Data are pooled from two independent experiments. (J) Representative FC analysis of CD44, CD62L, CD127, and CCR7 expression on CD4+ T cells from the spleen and BM of Klrk1flox (red line) and Klrk1floxCd4Cre (black line) mice. Shaded histogram represents live CD19+ cells (n = 3). Data are representative of two independent experiments.

