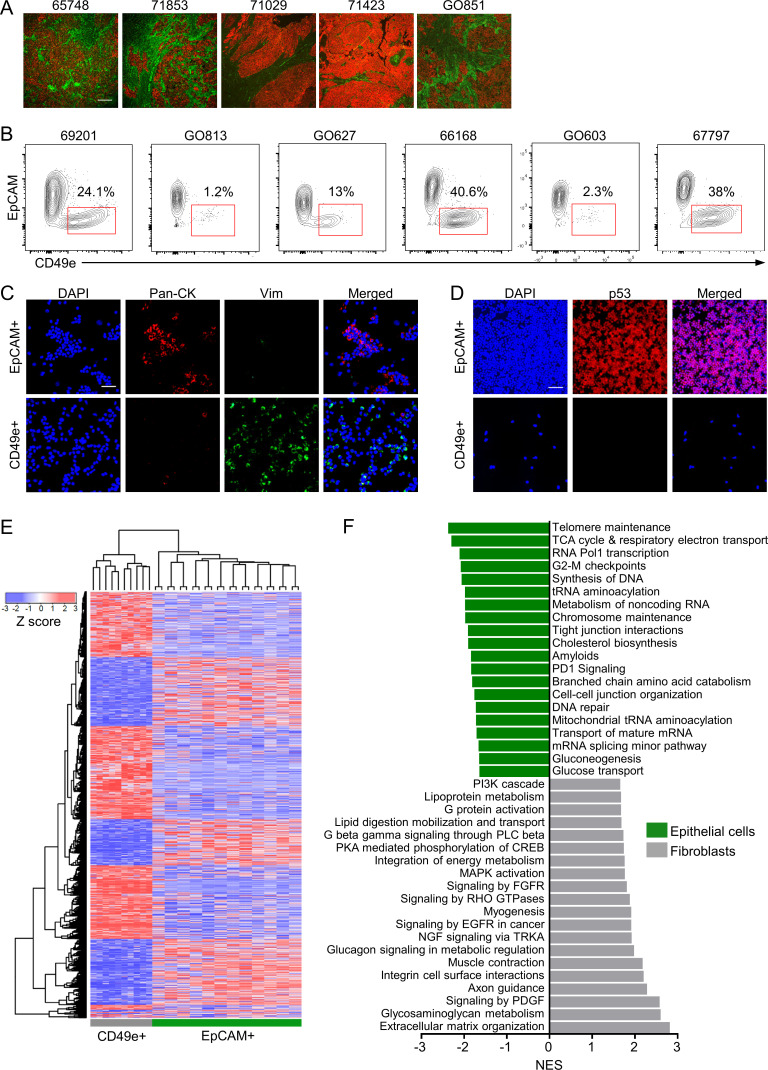
Figure 1.
Prospective isolation and transcriptional profiling of CAFs from primary HGSOC samples. (A) Representative images of IF on five different HGSOC samples using pan-CK (CK; red) and CD49e (green) antibodies. Scale bar = 100 µm. (B) Representative FACS plots from six different patients showing the viable, CD45−CD31− population stained for EpCAM and CD49e. (C) Representative images of cytospins made from isolated EpCAM+ or CD49e+ cells stained for pan-CK (red), vimentin (green), and Hoechst (blue). Scale bar = 50 µm. (D) Representative images of cytospins made from isolated EpCAM+ or CD49e+ cells stained for p53 (red) and Hoechst (blue). Scale bar = 50 µm. (E) Heatmap showing unsupervised hierarchical clustering of CD49e+ and EpCAM+ cells isolated directly from HGSOC tumor specimens and profiled by Illumina HT-12v4 microarrays. The EpCAM+ cells were separated into CD133+ and CD133− fractions. The heatmap shows EpCAM+ populations from 12 patients and CD49e+ samples from 10 patients due to data being of poor quality from two of the CD49e+ samples. (F) GSEA of the genes differentially expressed in the CD49e+ versus EpCAM+ populations. The top 20 nonredundant gene sets for each population are shown. CREB, cyclic adenosine 3′,5′-monophosphate response element-binding protein; EGFR, epidermal growth factor receptor; FGFR, fibroblast growth factor receptor; NES, normalized enrichment score; NGF, nerve growth factor; PKA, protein kinase A; PLC phospholipase C; RHO, Ras homolog family member; TRKA, tropomyosin receptor kinase A.

